Beginner’s Guide: Data Analysis with Pandas
Data analysis is the process of sorting through all the data, looking for patterns, connections, and interesting things. It helps us make sense of information and use it to make decisions or find solutions to problems. When it comes to data analysis and manipulation in Python, the Pandas library reigns supreme. Pandas provide powerful tools for working with structured data, making it an indispensable asset for both beginners and experienced data scientists.
What is Pandas?
Pandas is an open-source Python library for data manipulation and analysis. It is built on top of NumPy, another popular numerical computing library, and offers additional features specifically tailored for data manipulation and analysis. There are two primary data structures in Pandas:
• Series: A one-dimensional array capable of holding any type of data.
• DataFrame: A two-dimensional labeled data structure similar to a table in relational databases.
It allows us to efficiently process and analyze data, whether it comes from any file types like CSV files, Excel spreadsheets, SQL databases, etc.
How to install Pandas?
We can install Pandas using the pip command. We can run the following codes in the terminal.

After installing, we can import it using:

How to load an external dataset using Pandas?
Pandas provide various functions for loading data into a data frame. One of the most commonly used functions is pd.read_csv() for reading CSV files. For example:

The output of the above code is:
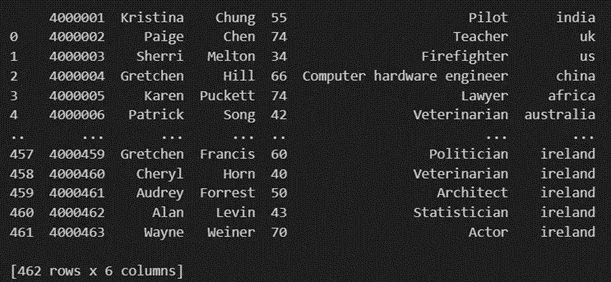
Once your data is loaded into a data frame, you can start exploring it. Pandas offers numerous methods and attributes for getting insights into your data. Here are a few examples:
df.head(): View the first few rows of the DataFrame.
df.tail(): View the last few rows of the DataFrame.
df.info(): Get a concise summary of the DataFrame, including data types and missing values.
df.describe(): Generate descriptive statistics for numerical columns.
df.shape: Get the dimensions of the DataFrame (rows, columns).
df.columns: Access the column labels of the DataFrame.
df.dtypes: Get the data types of each column.
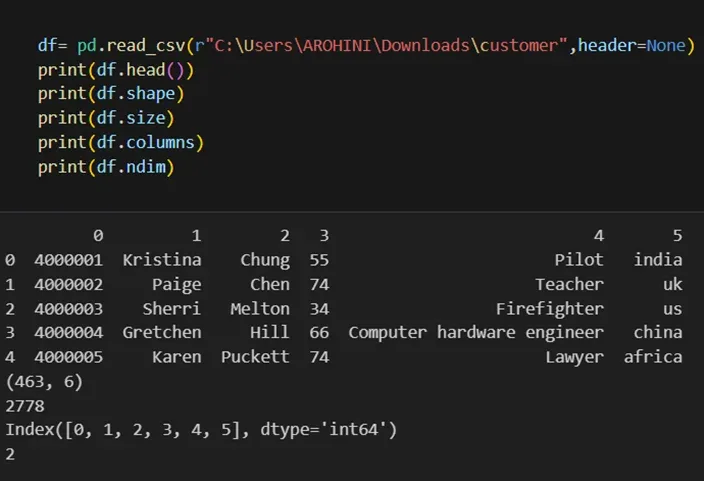
In data analysis, it is essential to do data cleaning. Pandas provide powerful tools for handling missing data, removing duplicates, and transforming data. Some common data-cleaning tasks include:
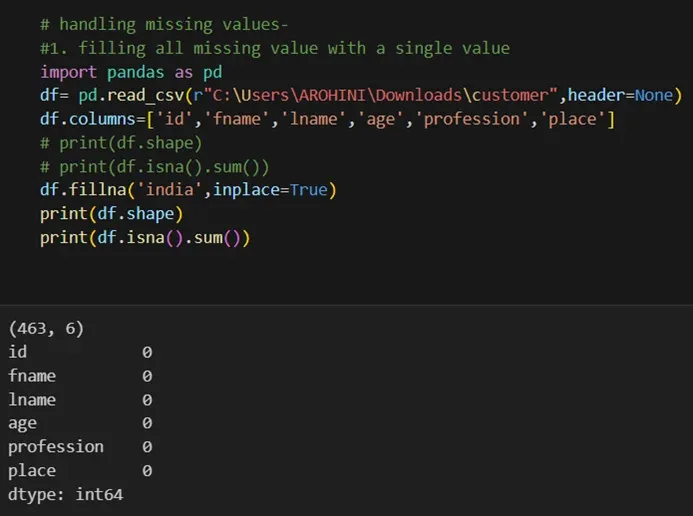
Handling missing values using methods like df.dropna() or df.fillna().
Removing duplicate rows with df.drop_duplicates().
Data type conversion using df.astype().
Renaming columns with df.rename().
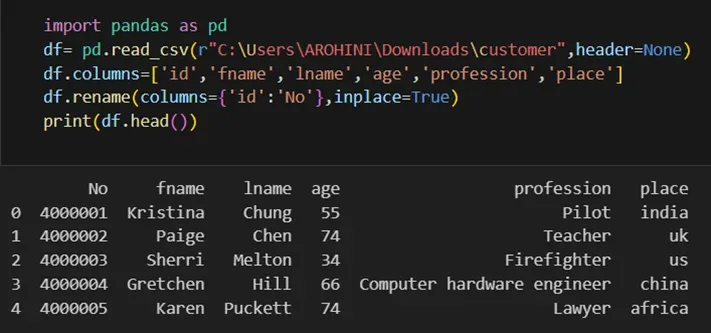
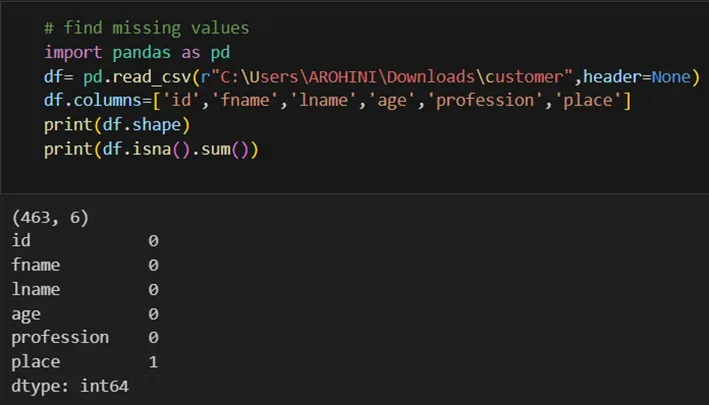
Pandas excels in data manipulation tasks such as selecting subsets of data, filtering rows, and creating new columns. Here are a few examples:
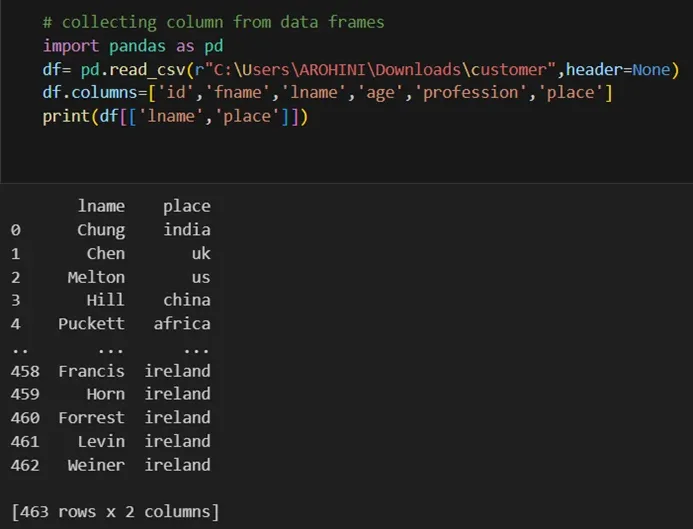
Selecting columns: df[‘column_name’] or df[[‘column1’, ‘column2’]].
Filtering rows based on conditions: df[df[‘column’] > value].
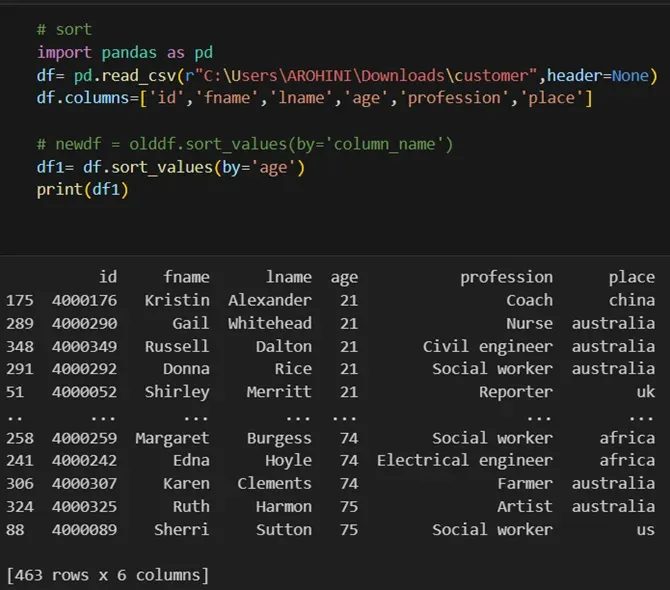
Sorting data: df.sort_values(by=’column’).
Grouping data: df.groupby(‘column’).mean().
With data cleaned and prepared, you can use Pandas to perform various analyses. Whether you’re computing statistics, performing exploratory data analysis, or building predictive models, Pandas provides the tools you need. Additionally, Pandas integrates seamlessly with other libraries such as Matplotlib and Seaborn for data visualization.


