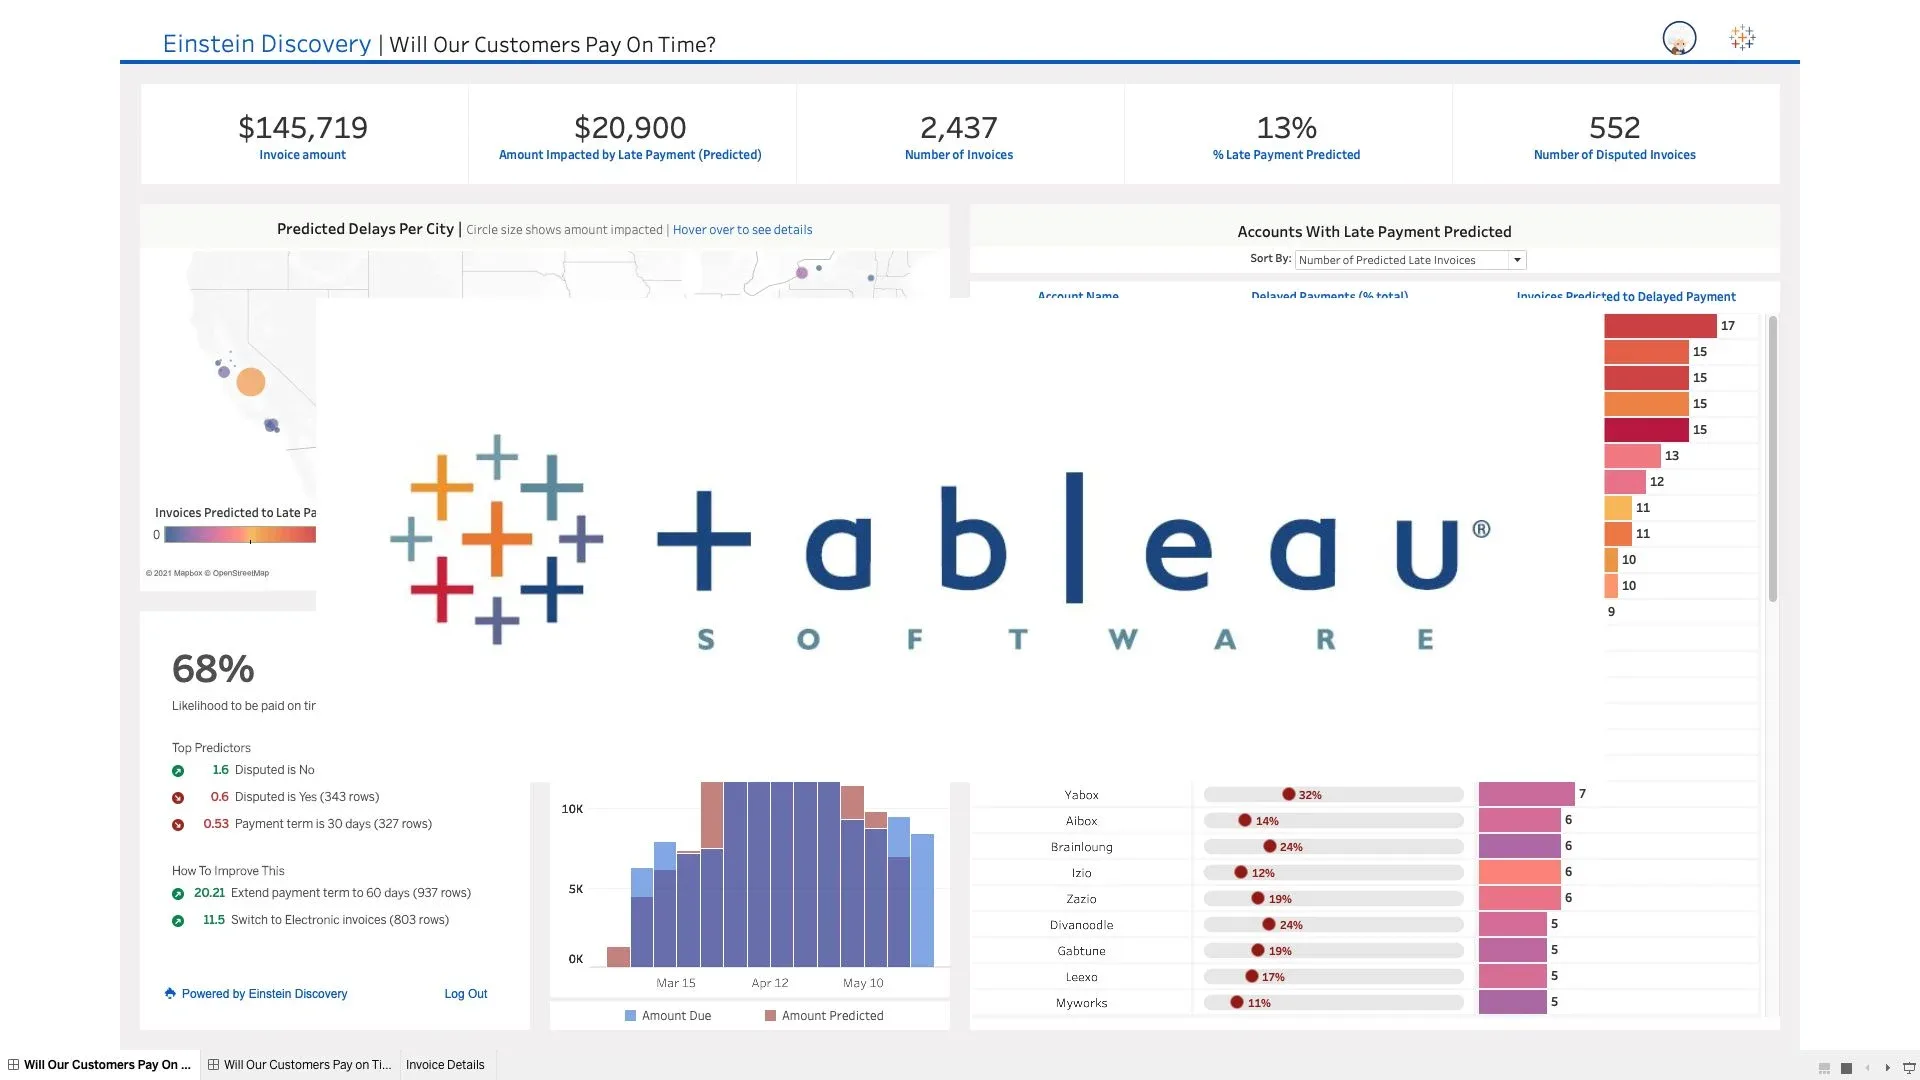
Tableau
Curriculum
-
Introduction
-
Connecting to & Preparing Data
-
Manage data properties
-
Introduction to Tableau Desktop
-
Understand aggregations
-
Create charts( What is it, When is it used)
-
Bollinger Bands
-
Bump chart
-
Control charts
-
Cards
-
Funnel chart
-
Step and Jump lines
-
Pareto chart
-
Waterfall chart
-
Heat Map
-
Scatter Plot
-
Pie chart and Bar graph
-
Bubble Chart
-
Bullet Graph
-
Circle Views
-
Grouped Bar or Side by Side Bars Chart
-
Combination Chart
-
Cumulative Histogram
-
Lollipop Chart
-
Word Cloud
-
Motion chart
-
Dual Lines Chart
-
Advanced charts (with use cases) eg- dendrogram chart
-
Filters
-
Apply analytics to a worksheet
-
Explain when to use a parameter
-
Create a calculated field (e.g. string, date, simple arithmetic)( TWO USE CASES)
-
Add a manual or a computed sort
-
Tooltip
-
Cross tabs
-
Totals and Subtotals
-
Percent of totals
-
Small Multiples
-
Discrete Vs Continuous
-
Explain the difference between discrete date parts and continuous date values
-
Add a reference line
-
Trend Line
-
Forecasting
-
Conditional forecasting
-
Create Group, Sets
-
DATA Blending
-
Use a quick table calculation
-
Use bins and histograms
-
Display totals on a worksheet
-
HierarchyLOD-Fixed, Include, Exclude.(use case of LODS)Drill Without HierachyTop5 state/cities(USE CASE)
-
Maps
-
Functions
-
Create and modify a dashboard
-
Add worksheets to a dashboard
-
Add interactive elements for consumers (e.g. show filters, data highlighter, tooltips)
-
Add dashboard actions (e.g. filter action, highlight action, parameter control, URL action)
-
Configure a dashboard layout and create device-specific dashboards
-
Create a story and a story point
-
Introduction
-
Connecting to & Preparing Data
-
Manage data properties
-
Introduction to Tableau Desktop
-
Understand aggregations
-
Create charts( What is it, When is it used)
- Bollinger Bands
- Bump chart
- Control charts
- Cards
- Funnel chart
- Step and Jump lines
- Pareto chart
- Waterfall chart
- Heat Map
- Scatter Plot
- Pie chart and Bar graph
- Bubble Chart
- Bullet Graph
- Circle Views
- Grouped Bar or Side by Side Bars Chart
- Combination Chart
- Cumulative Histogram
- Lollipop Chart
- Word Cloud
- Motion chart
- Dual Lines Chart
- Advanced charts (with use cases) eg- dendrogram chart
-
Filters
-
Apply analytics to a worksheet
- Explain when to use a parameter
- Create a calculated field (e.g. string, date, simple arithmetic)( TWO USE CASES)
- Add a manual or a computed sort
- Tooltip
- Cross tabs
- Totals and Subtotals
- Percent of totals
- Small Multiples
- Discrete Vs Continuous
- Explain the difference between discrete date parts and continuous date values
- Add a reference line
- Trend Line
- Forecasting
- Conditional forecasting
- Create Group, Sets
- DATA Blending
- Use a quick table calculation
- Use bins and histograms
- Display totals on a worksheet
- HierarchyLOD-Fixed, Include, Exclude.(use case of LODS)Drill Without HierachyTop5 state/cities(USE CASE)
-
Maps
-
Functions
-
Create and modify a dashboard
- Add worksheets to a dashboard
- Add interactive elements for consumers (e.g. show filters, data highlighter, tooltips)
- Add dashboard actions (e.g. filter action, highlight action, parameter control, URL action)
- Configure a dashboard layout and create device-specific dashboards
- Create a story and a story point