Asquare Technologies
Dashboard
Welcome to the Student Projects Dashboard! Here, you can explore a curated collection of exceptional projects completed by previous students using Power BI and Tableau. These projects showcase the innovative approaches and analytical skills our students have applied to tackle real-world data challenges. Whether you’re looking for inspiration, insights, or examples of best practices, this dashboard serves as a valuable resource to guide your own journey in data visualization and analysis. Dive in to see how data can be transformed into powerful stories and actionable insights!
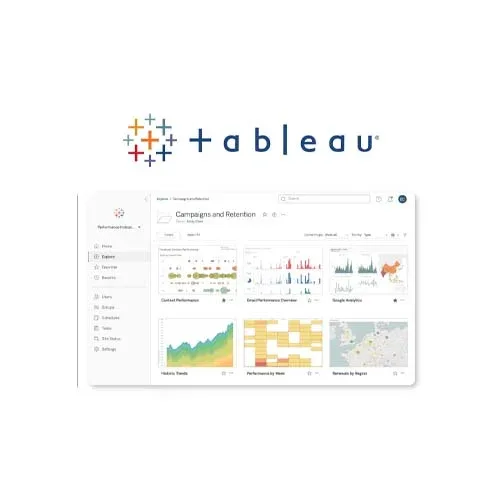
Showcasing Brilliance: Explore the Success of Our Trainees with a Sneak Peek at Sample Projects Completed Using Tableau After Training.
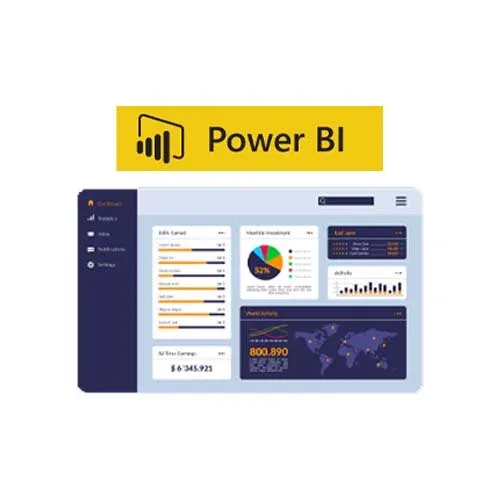
Showcasing Brilliance: Explore the Achievements of Our Trainees with a Glimpse of Power BI Projects Completed After Training


