AT-Manager
- 01 Dec, 2025
- 0 Comments
- 1 Min Read
Automotive Sales & Operations Analytics
This Power BI report provides a comprehensive analysis of an automobile dealership’s performance across leads, test drives, sales, and expenses. It highlights key KPIs such as total leads, qualified and lost leads, conversion rates, and monthly trends, supported by detailed breakdowns of lead sources and lead status distribution. The report also evaluates test-drive effectiveness through model-wise performance, employee-wise conversion, and monthly test-drive trends. Sales performance is explored through total cars sold, revenue generated, top-selling models, salesperson performance, and age-group sales insights. Additionally, the expenses section reveals monthly spending patterns, category-wise cost allocation, salary breakdowns, and cost efficiency metrics such as expense per car sold. Together, these dashboards offer a clear, data-driven view of overall operational and financial efficiency.
More Templates
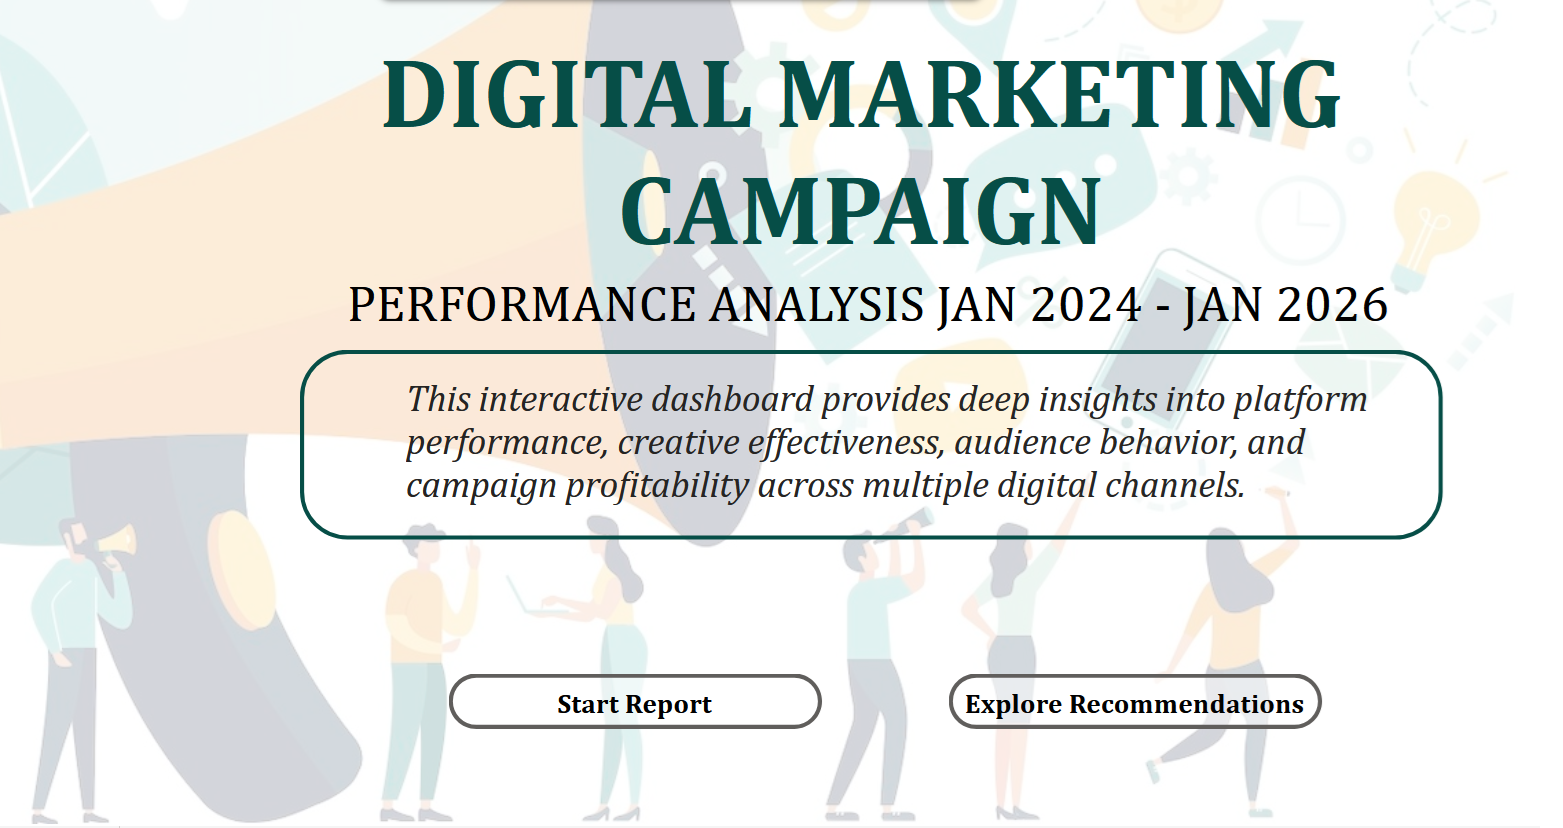
This interactive dashboard provides deep insights into platform performance, creative effectiveness, audience behavior, and campaign profitability across multiple digital channels.
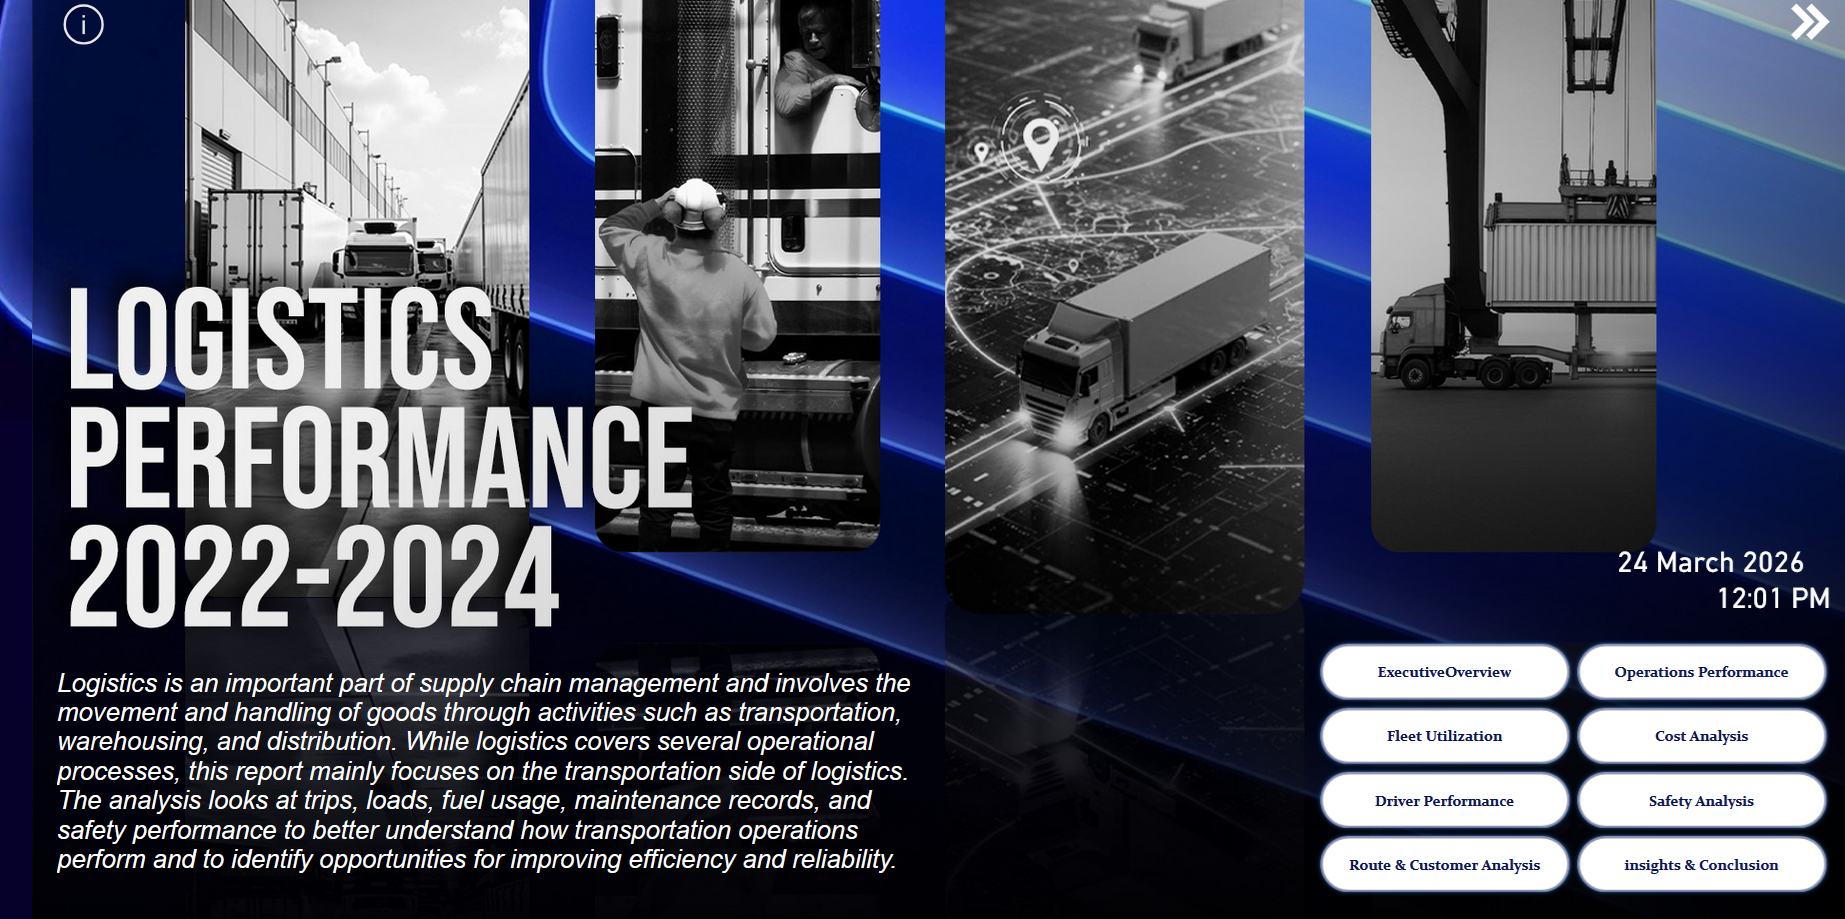
Logistics is an important part of supply chain management and involves the movement and handling of goods through activities such as transportation, warehousing, and distribution. While logistics covers several operational processes, this report mainly focuses on the transportation side of logistics. The analysis looks at trips, loads, fuel usage, maintenance records, and safety performance to better understand how transportation operations perform and to identify opportunities for improving efficiency and reliability
This Power BI dashboard provides an interactive analysis of an electronic retail store’s performance, presenting key metrics such as total revenue, customer count, transactions, and year-over-year growth, along with insights into monthly trends, sales channels, and regional performance to support informed business decisions.
This Power BI report provides a comprehensive overview of a retail jewellery business by integrating sales, customer, salesperson, product, and expense data into a single interactive dashboard.
A unified Power BI dashboard offering end-to-end insights into dealership leads, test drives, sales performance, and expenses, enabling informed decision-making and improved operational efficiency.
AgriSense Dashboard delivers key insights on crop production and exports to drive smarter, data-based agricultural decisions.
Complete insights into textile sales, products, marketing, and expenses for smarter business decisions
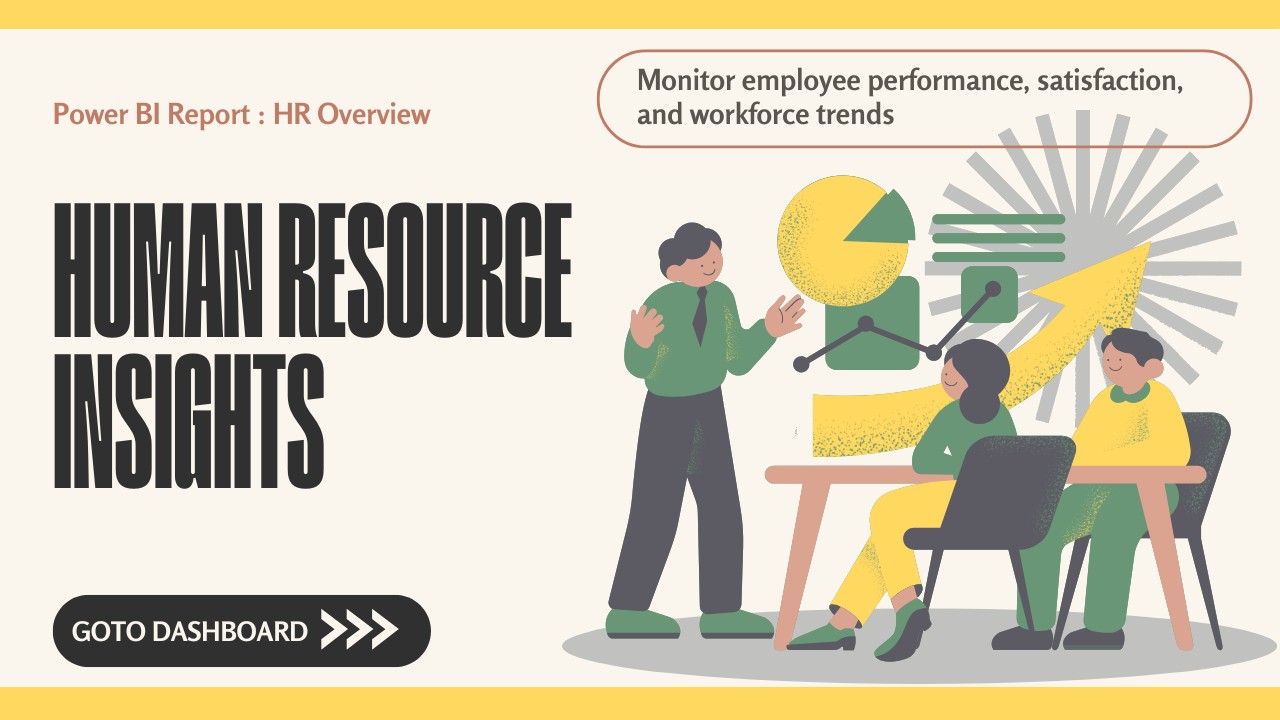
HR Data Performance Hub. Make it Yours?
Get Access to Tourism Analytics & Insights
Purchase the E-commerce Analytics Report