


- 18 May, 2026
- 0 Comments
- 5 Mins Read

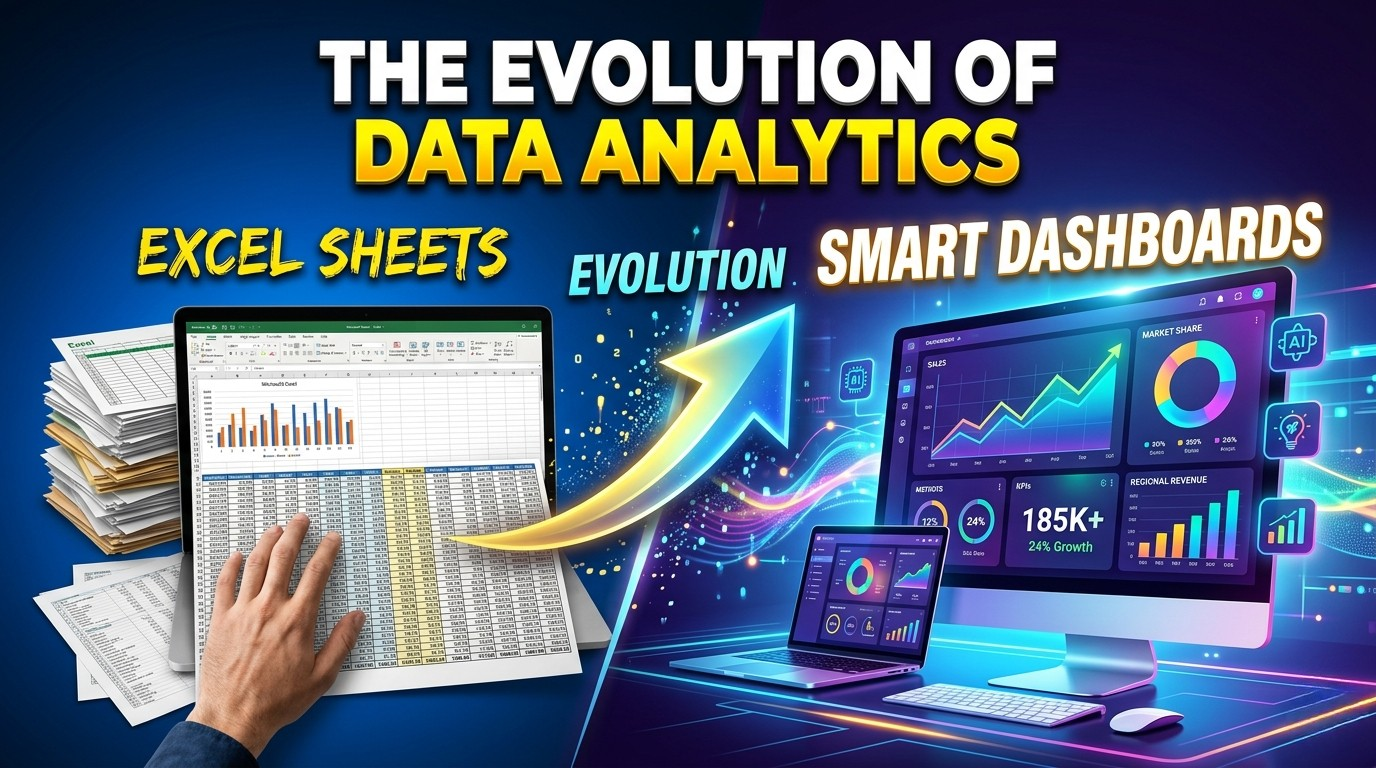
From Excel Sheets to Smart Dashboards:The Evolution of Data Analytics.
The Data-Driven World
Data has always been the backbone of decision-making. From ancient merchants tracking inventory on papyrus to modern CEOs monitoring KPIs in real time, the goal is the same: turn raw information into insight.
For decades, Microsoft Excel was the undisputed king of analytics. It was accessible, flexible, and powerful enough for most business needs. A spreadsheet could track sales, calculate budgets, and even run basic forecasts.
For many organizations, Excel was data analytics. But data has changed. Volume, velocity, and variety have exploded. We now generate 328 million terabytes of data every day. Manually updating rows and columns can’t keep up. Stakeholders don’t want static tables. They want answers instantly, visually, and on any device.
This shift gave rise to a new era: smart dashboards. Tools like Power BI, Tableau, and Looker now connect directly to live data sources, update automatically, and let users drill down with a click. They don’t just report what happened. They help predict what will happen next.
This blog traces that evolution. We’ll explore how we moved from Excel sheets to interactive dashboards, why it matters, and what skills you need to thrive in this new landscape.
The Excel Era – Strengths and Limitations
Excel democratized data analysis. Launched in 1985, it put calculation power on every desktop.
Its strengths are legendary:
Why Excel dominated:
- Accessibility: Almost every professional knows the basics
- Flexibility: Build anything from a grocery list to a financial model
- Functionality: Pivot Tables, VLOOKUP, and later Power Query gave it real analytical muscle
- Low cost: No extra licenses for basic use
Excel is perfect for ad-hoc analysis, quick calculations, and small datasets. Many startups still run entirely on Excel.
Where Excel falls short:
- Scale: Excel caps at 1,048,576 rows. That’s tiny for IoT, web, or transaction data
- Collaboration: “Final_v3_REAL.xlsx” version chaos is real. No single source of truth
- Automation: Manual refreshes and copy-paste errors cost hours and credibility
- Visualization: Charts are static. No drill-down, no filtering, no mobile experience
- Governance: No row-level security. Anyone with the file sees everything
Excel isn’t dead. But it’s no longer enough when decisions need to be made in minutes, not days.
The Turning Point – Rise of Self-Service BI
Around 2010, 3 trends collided: cloud computing, big data, and business frustration with IT bottlenecks. Teams needed insights faster than IT could build reports.
Enter “self-service BI”. Microsoft’s Power Pivot in 2010 let Excel handle millions of rows by loading data into an in-memory model. Power Query in 2013 automated data cleaning. The real game-changer came in 2015: Power BI Desktop was released as a free tool that combined both, plus rich visuals.
What changed:
- Data connectivity: Instead of copy-pasting, connect directly to SQL, Salesforce, Google
Analytics, PDFs, and 200+ other sources
- Data modeling: Build relationships between tables once, reuse everywhere
- DAX: A formula language for complex measures like YTD sales or rolling averages
- Automatic refresh: Schedule data to update hourly without human touch
Suddenly, a financial analyst could build what used to require an entire IT team. The role of
“citizen data analyst” was born. Excel wasn’t replaced. It became a data source _for_ Power BI.
Anatomy of a Smart Dashboard
A smart dashboard is more than pretty charts. It’s a living interface between humans and data. Here’s what sets it apart:
- Interactivity
Click a bar for “West Region” and every chart on the page filters instantly. Slicers let users pick date ranges, products, or customers. Drill-through pages answer “why” without rebuilding reports.
- Real-time or Near Real-time
Connect to streaming data. A logistics manager can watch shipments move. A sales lead sees pipeline changes as they happen. No more “the data is as of last Friday.”
- Mobile-first Design
Executives check KPIs on phones. Power BI Mobile reformats visuals automatically. Set data alerts to get pinged when revenue drops 10%.
- AI Built-in
Features like Q&A let users type “sales last quarter by product” and get a chart. Key Influencers finds what drives churn. Decomposition Tree breaks down metrics automatically.
- Governance + Security
Row-level security means a regional manager only sees their region. Dataset certifications tell users which data is trusted. This solves Excel’s biggest weakness.
A smart dashboard doesn’t just show data. It guides decisions.
From Excel to Power BI – A Practical Migration Path
Moving from Excel to dashboards isn’t “rip and replace.” It’s evolution. Here’s a proven 4-step path:
Step 1: Audit Your Excel Work
List reports you update weekly. Which ones take >30 min? Which involve copy-paste? Those are dashboard candidates.
Step 2: Recreate in Power BI, Don’t Migrate
Don’t import ugly Excel logic 1:1. Rebuild with proper data modeling. Use Power Query instead of nested IF statements. One well-built dataset can feed 10 dashboards.
Step 3: Upskill on 3 Pillars
- _Power Query_: For data cleaning. Replaces manual steps
- _Data Modeling_: Star schema basics. Relationships, not VLOOKUP
- _DAX_: Start with SUM, CALCULATE, and time intelligence
Step 4: Drive Adoption
Build for your audience. Sales needs speed, not complexity. Finance needs accuracy and audit trails. Train users to self-serve with slicers instead of asking you for new cuts.
Pro tip: Keep Excel for what it does best. Use it for quick scenarios or data entry. Use Power BI for sharing, scaling, and storytelling.
The Future – Where Dashboards Are Headed
The evolution isn’t over. Three trends are shaping next-gen analytics:
- Augmented Analytics
AI will generate narratives automatically. “Revenue is down 8% because West Region missed targets and Product X was out of stock.” Tools like Copilot in Power BI already write DAX and summarize visuals.
- Unified Analytics
The line between BI, AI, and apps is blurring. Microsoft Fabric puts data engineering, warehousing, and BI in one place. You’ll move from dashboard to machine learning model without exporting CSVs.
- Data Culture Over Tools
Tech is the easy part. The hard part is getting people to trust data and act on it. Organizations winning with analytics invest in data literacy for all employees, not just analysts.
Final Thought
Excel taught the world to think in rows and columns. Smart dashboards are teaching us to think in relationships, trends, and actions. You don’t need to abandon Excel. But if you’re still emailing spreadsheets in 2026, you’re making decisions on yesterday’s data.
The evolution from Excel sheets to smart dashboards isn’t about software. It’s about speed, scale, and confidence. The question isn’t “Excel or Power BI?” It’s “How fast can we turn data into decisions?”