


- 17 Jan, 2024
- 0 Comments
- 3 Mins Read

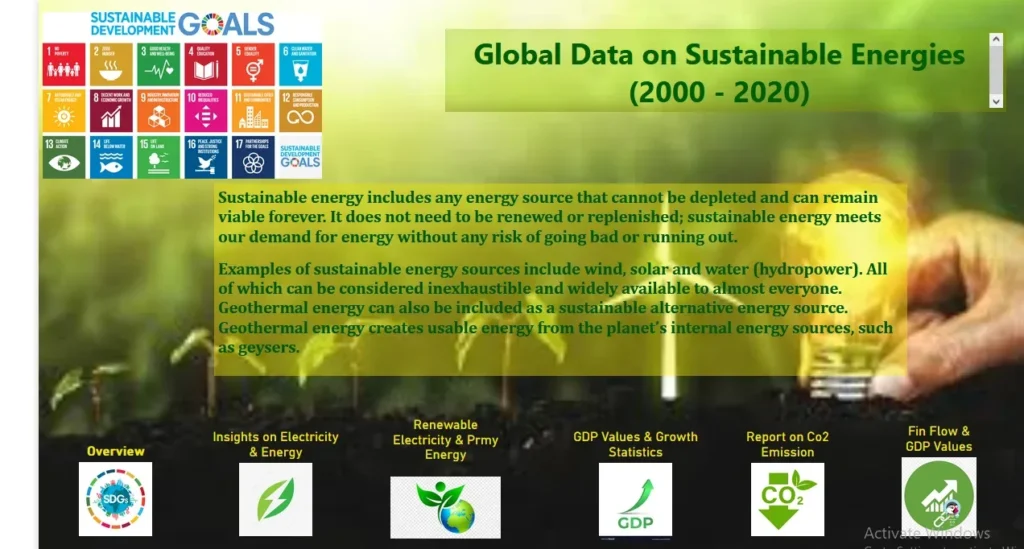
Document on Global Data on Sustainable Energy:- (2000 to 2020)
I want to build Power Bi report on some good concept. So, I took Global data on Sustainable Energy. I was unaware of many terminologies used in the data set like Energy Intensity, Power Parity and many other things. Later I did research & studied the concepts from different websites to understand the domain. Because until & unless I understand the subject, I cannot analyze the data in it.
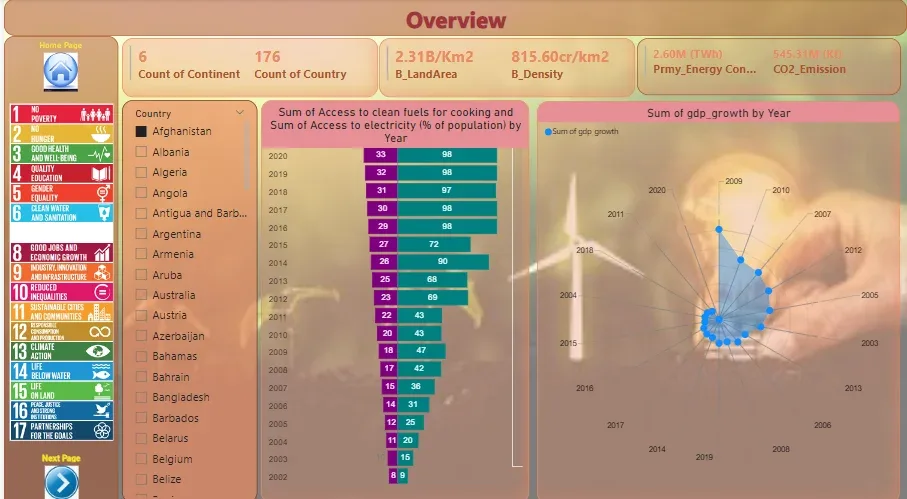
Then I saw that in so many columns, data is null. I didn’t want to change the data set as I had already done research & studied about it. Then I started searching for the required data & I entered the values for all the countries (176 countries) & for all the years (20 years).
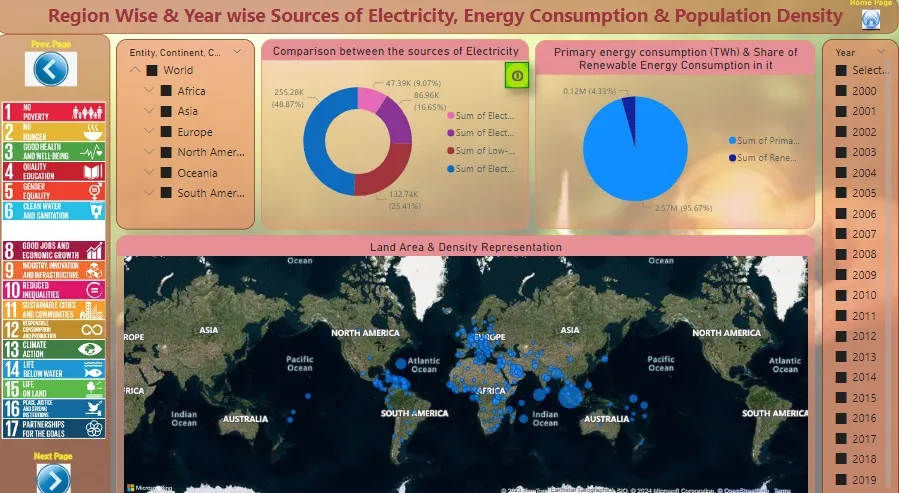
Also, I faced the problem that the values of each attribute is stored in different formats. Some are in percentage, some in kilowatts, some in billion, millions etc., which restricted me from comparing the entities. Also, when I tried to analyze the GDP growth rate, I realized that growth is according to size of the country because of which poor, underdeveloped countries growth rate was higher than the most developed countries. I was not able to project it properly. Then I researched GDP Values in millions & entered them for all the countries & for all the years, through which I was able to show the actual GDP values of the countries. I even added the column World & Continent & categorized these countries into their continents, So that we can analyze according to continents too.
In the data set there was only mention of ‘Renewable Energy Consumption Share’ but no Primary Energy Consumption. So, I searched for primary energy consumption, so that I have show the share of renewable energy share in final consumption.
Then I created Factless Fact table with country & its code data, & used it as a bridge table between my ‘Energy Data’ table & ‘Primary Energy Consumption’ table. I have used Both in Cross filter direction to get the data, filtered & analyzed properly.
I have even deleted a column called Renewable (% Equivalent primary Energy) as there was no(zero) data in that column.
Still there are many empty data in the dataset like as not all countries get financial flows as an aid. Only developing countries receive. And some others too. I tried my best to fill the blanks but still some values are not available.
All the newly researched data I entered it in my source file (Excel) & I had updated it in Power bi by refreshing the data imported.
Finally, The data was ready to get analysed. I had created many measures like
- B_Density – To display total population density per Km2 and to add units to it.
- B_LandArea – To display Total Land area per Km2 & to add units to it.
- N o of Countries :- To find out the no of Countries.
- Co2 Emission :- To sum up Co2 Values & to apply unit to it.
- GDP Values:- To sum up GDP Values
- Primy_Energy Consumption :- To sum up the values along with applying Units to it.
- Ranking on Co2 = To rank the countries according to the emission of Co2.
- Ranking on GDP :- to Rank the countries according to their GDP Values.
Even I have Created hierarchy between regional Values. And also, I have created different bookmarks showcasing the GDP values in different perspective. I have used Selection to select Visuals to display during bookmarks.
I have tried to add few information in the different pages of the report & had linked it on to required visuals through info button. I have given even certain links for further studies at the end of report. I have attached the description of all the attributes in the report.
I have tried to the best of my knowledge to analyse the Global Data on Sustainable Energy. Still Suggestions are always welcomed as I am keen learner.
For more details of the project watch video
For More:
Power BI Projects: Click Here
Tableau Projects : Click Here