


- 30 Apr, 2025
- 0 Comments
- 1 Min Read

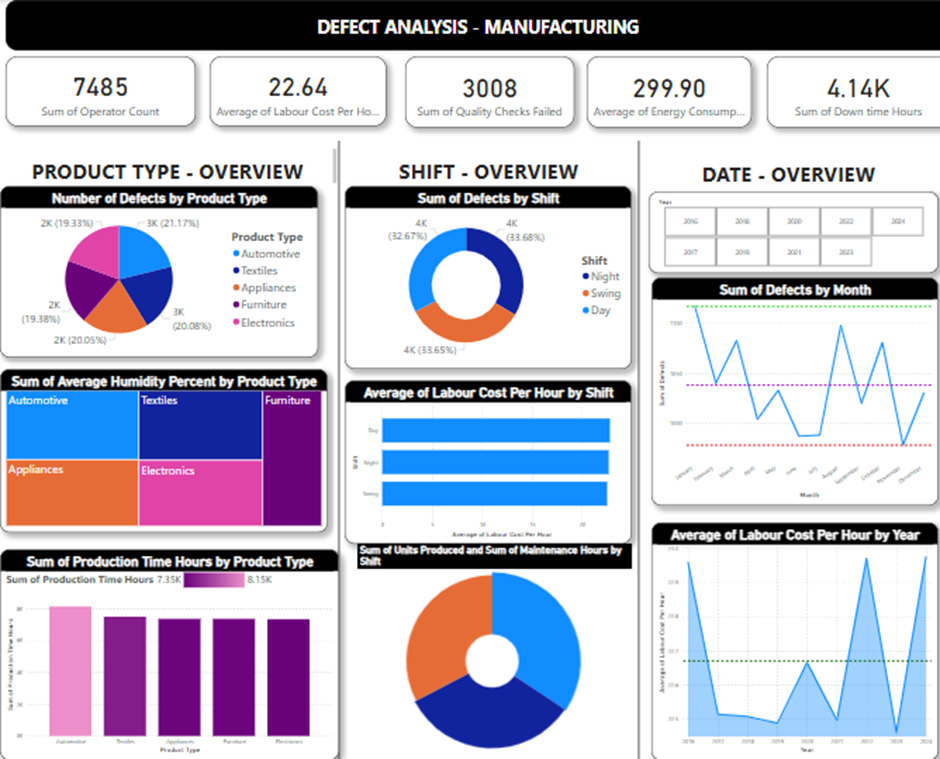
DEFECT ANALYSIS IN MANUFACTURING – From Raw Data to Visual Stories: A Power BI Approach
In the manufacturing process, inconsistencies leading to product defects represent a significant challenge, impacting overall efficiency, cost-effectiveness, and product quality. Analysing the provided manufacturing dataset, which includes various production parameters, the objective is to identify the key factors and their interrelationships that contribute to the occurrence of defects.
Solution
The data was present in a postgreSQL database. To get the data loaded to Power BI desktop if your data is present in postgreSQL database, you’ll need the following information to connect:
- Server Name/IP Address: The address of your PostgreSQL server.
- Database Name: The name of the specific database containing your manufacturing data.
- Port Number: The port PostgreSQL is listening on (usually 5432).
- Username: Your PostgreSQL username.
- Password: The password for the specified username.
PostgreSQL ODBC Driver (if needed): In some cases, you might need to install the PostgreSQL ODBC driver on your machine if Power BI doesn’t automatically recognize your PostgreSQL installation. You can usually find this on the official PostgreSQL website or through a quick web search for “PostgreSQL ODBC driver download”.
The loaded data was not perfect and it required some cleaning before proceeding with the visualizations. I did a data profiling using the power query editor. It hadsome errors, which had to be replaced with some default values. Then there were some blank rows. I had to remove them.
To generate interactive insights, I employed straightforward DAX measures, including Total Operator Count, Average Labour Cost, Total Quality Check Failures, Total Downtime Hours, and Average Energy Consumed. The resulting dashboard empowers users to investigate defect analysis across various product types, shifts, and dates.
The following are the significant outcomes from the dashboard
- Defect Rates by Product Type
- Impact of Shift on Defects
- Temporal Trends in Defects
- Correlation with Downtime
- Relationship with Energy Consumption
- Impact of Operator Count
Actionable Insights for Improvement
- Targeted Improvement Efforts
- Performance Monitoring
- Data-Driven Decision Making
- Identifying Potential Cost Savings