


- 08 May, 2024
- 0 Comments
- 44 Mins Read

Are you looking for Popular Investment Options Plans? – Optimum Portfolio Generation – Smart way to invest money
Optimum Portfolio Generation
Project Documentation
Introduction
Choosing the best investment options for wealth management is an area of concern for people of all income groups. There are several long-term and short-term investment options that you can opt for, considering your goals and risk appetite. Select your preferred investment type to go into the details.

Optimum Portfolio means a mix of investments that can balance returns and risk. The “optimum portfolio generator” is similar to those combo options in your food menu where it shows you all the best combinations of assets you can choose from to maximize returns while minimizing risks. It’s about exploring different combinations of investments to discover the best mix that gives you the most return for a level of risk you’re comfortable with. We can generate a large number of optimal portfolios. Each portfolio represents a unique mix of assets—like stocks, bonds, mutual funds, or other investments—that offers the highest possible return for a given level of risk. An investor can choose his fine-tuned investment strategy to match his investment goals based on his risk tolerance. In this project, we have taken Banks & Post Office Schemes, Equity, Mutual funds, Bonds and Reits&Invits as choices of assets. All information and calculations in this Power BI project are based on original market data analysis.

BANKS
Fixed and recurring deposits and post office schemes are often considered amongst the safest, most stable, and among best low risk investment options. The following pages provide information to effectively invest in banks and post office schemes.

Resource Gathering and Extraction
All information and calculations are based on original market data analysis. The following sites are used for data extraction of banks and post office schemes.
- For Bank Rates and Schemes: Paisa Bazar Website: https://www.paisabazaar.com/ & Bank Bazar Website: https://www.bankbazaar.com/
- For Post Office Schemes : India Post Website: https://www.indiapost.gov.in/
Visualizations
Page 1: Bank Insights
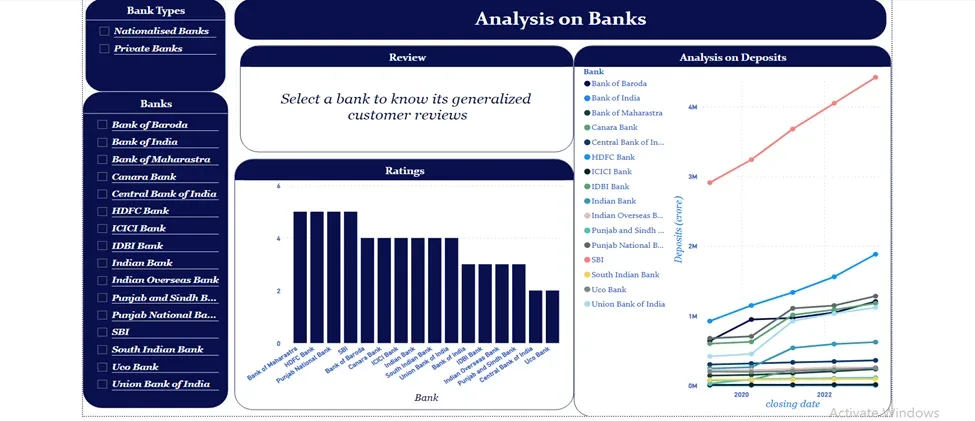
Objective: The user can gain a quick insight into the bank based on the review and the number of people choosing it based on the deposits that the bank holds
Visuals:
Slicer – for sorting banks
Card- To display review
Bar graph- To display star rating
Line graph- To display a 5-year deposit
Page 2: FD and RD
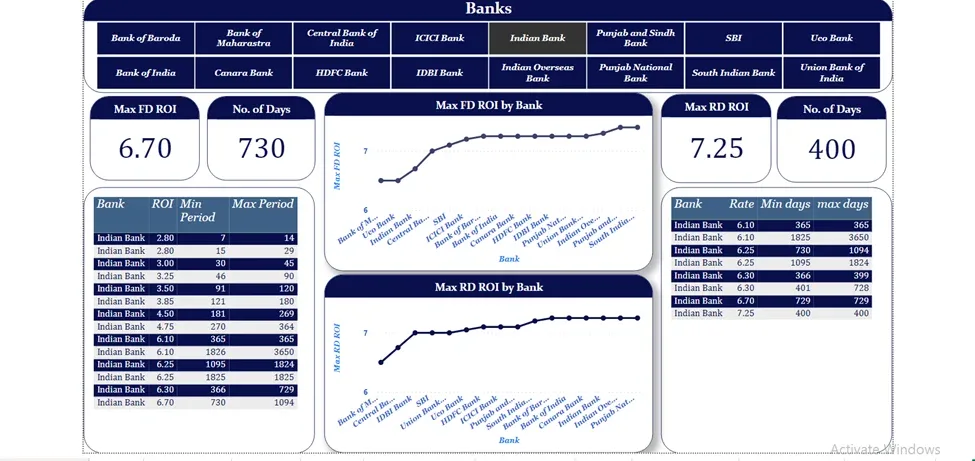
Objective: To know more about FD and RD and how the interest rate changes with the chosen maturity period. And also, to know the maximum interest rate provided by banks and the number of days needed to get those interests.
Visuals:
Slicer – For sorting banks
Table 1- To show the FD rates and their period for different banks
Table 2- To show RD rates and their period for different banks
Line graph 1- To get an insight into which bank gives the highest FD rate
Line graph 2 – To get insight into which bank gives the highest RD rate
Cards- To display the highest rate and their period
Page 3: FD vs RD
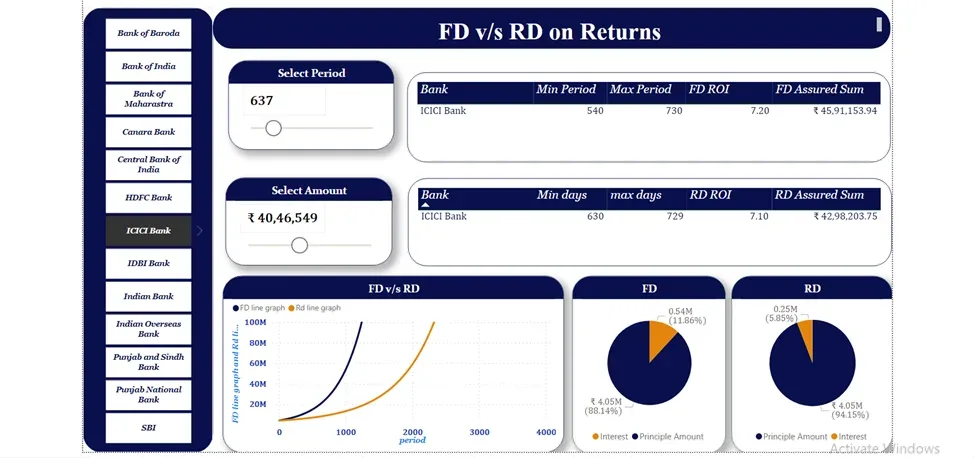
Objective: Comparison between FD and RD returns. Users can find out which will provide more returns for the same amount after the same period.
Visuals:
Slicer- For sorting banks
Parameters – To give input for the amount and period
Table 1- To display Return details of FD
Table 2- To display Return details of RD
Line graph – To show the comparison of FD and RD returns of selected bank
Pie charts – To show how much part in the assured sum is the principle amount and how much is the returns
Calculations:
FD Assured Sum (1+OI/400)^(year*4)* principal amount
RD Assured Sum = FV(ROI/1200,months,installment amount)
FD and RD returns – To get the internet amount for the pie chart
FD Returns = FD assured sum – Principal amount
RD Returns = RD assured sum – principle amount
ROI = Rate of Interest.
FD = Fixed Deposit
RD = Recurring Deposit
FD line and RD line – The calculated value of the assured sum is used for creating a line chart
Page 4: Post Office Schemes
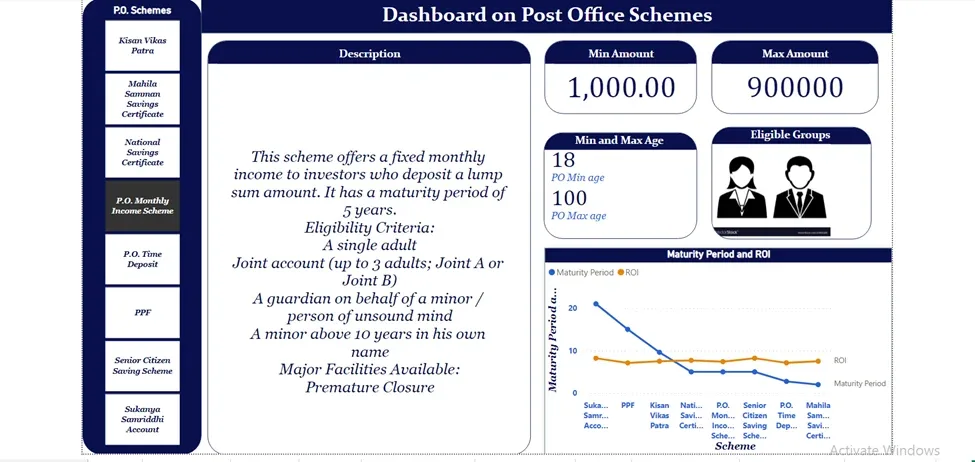
Objective: To understand various Post office schemes available.
Visuals:
Slicer- For sorting PO Schemes
Big Card – To display the details about PO Schemes
Image – To show the eligible groups for the schemes
Multi-row card – To show the min and Max age required for the schemes
Small cards – To display the min and Max amount that can be deposited
Line graph – To show the comparison between the maturity period and the ROI
Page 5: Options for You
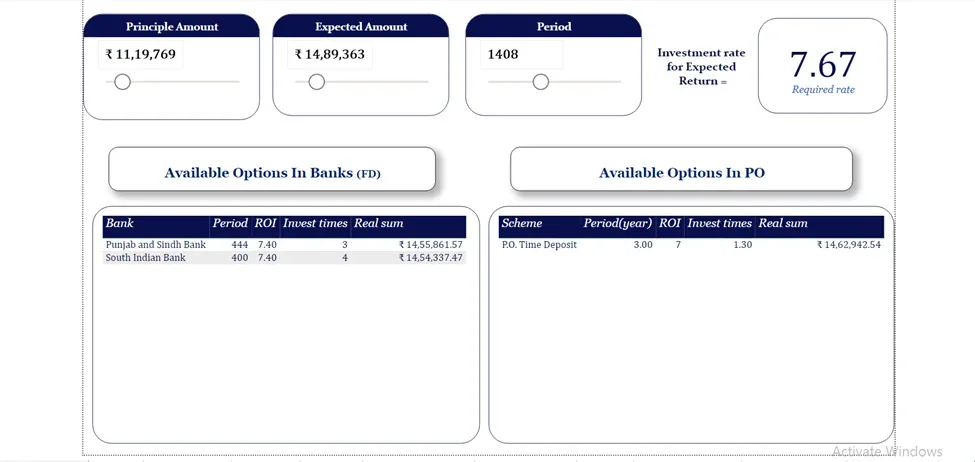
Objective: To know about the available options based on the amount a person is willing to invest for a particular period of time to get his desired sum.
Visuals:
Parameters- For inserting principal amount, Period, and expected amount
Tables- To display the real sum that will be returned after the chosen period
Card – for displaying the rate required to get the expected sum
Calculations:
Required Rate- To get the required rate after giving the principal amount, period, and the expected amount
FD actual rate- To get the rates of FD into a measure
Fd diff- Difference between the FD actual rate and the required rate
Fd diff rank- To rank the difference and find out which one is closest to the required rate
Fd invest times- To get the number of times one should invest for the given period by him. It is found by dividing the period parameter by the min period column in the table Bank FD
fd invest times = Given period/Maturity period
Fd real sum =((FD assured sum-principal amount)*Fd invest times)+principal amount
Po diff day rank – To get the difference between the given period and the maturity period of po schemes
Po diff days- To get the difference between the given period and the maturity period of po scheme
Po invest times- To get the number of times one should invest for the given period by him. It is found by dividing the period parameter by the maturity period column in the table Post Office
Po real sum– To find the real return that the person will get if he follows the options
Po real sum =(((1+ PO rate/400)^(4*year)*principal amount)-principal amount)* po invest times)+ principal amount
OPG page
Data from the Bank is used to create a table for generating the optimum portfolio page
EQUITY INVESTMENT ANALYSIS
Equity investing is one of the best investment options for both long-term and short term purpose. It is about the equity shares of a company, which binds you in legal terms related to the company ownership. As an investor, you must know that a company’s performance has an impact on the share price, both positive and negative. Depending on the market conditions and your risk appetite, you can also choose to give up the shares back later either to the company or a third party. The following pages provide information to effectively invest equities.

Resource Gathering and Extraction
- For Daily Market Reports of Stock: NSE Website: https://www.nseindia.com/
- For Daily Market Reports of Index: NSE Website: https://www.nseindia.com/
- For Current Company List of Nifty 50: NSE Website: https://www.nseindia.com/
- For reports of Ipo: https://www.moneycontrol.com/
- For Sector wise classification: https://www.groww.com/
All information and calculations are based on original market data analysis. The following sites are used to extract current market data on equity. All the above data were downloaded in CVS/text formats and copied to a single Excel sheet and each data was converted to table format for convenience. The period considered for Analysis of the Daily Market Report: 6- March 2023 to 5- Mar 2024
Visualisations
Page 1: Stock Screener
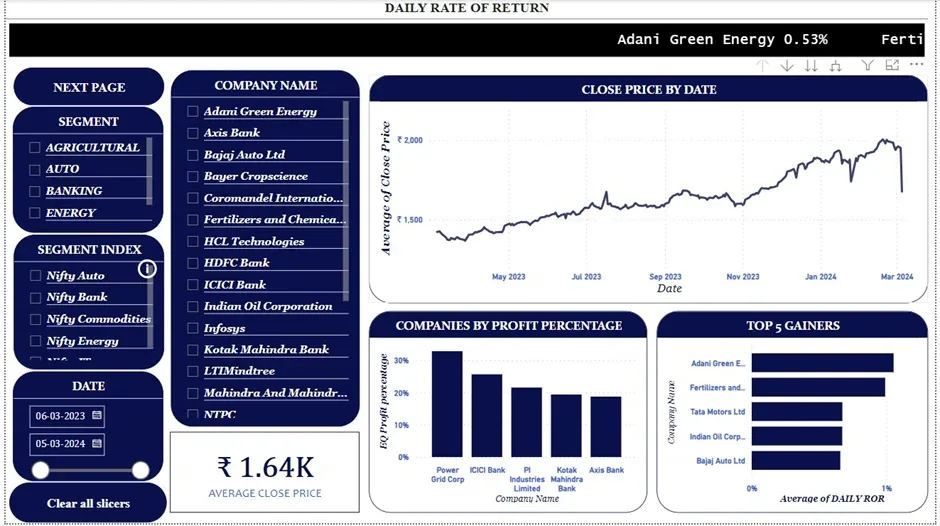
This Page provides basic overall pieces of information about selected 23 stocks.
- Segment
Segment is the category or Industry in which the stocks come in.
- Stock market Index
A stock market index – it is a statistical source that measures financial market fluctuations. The index is a performance indicators that indicate the performance of a certain market segment or the market as a whole.
A stock market index is constructed by choosing equities from similar companies or those that match a predetermined set of criteria. These shares are already listed on the exchange and traded. Share market indexes can be built using a range of variables, including industry, segment, or market capitalization.
Each stock market index tracks the price movement and performance of the stocks that comprise the index. This simply means that the success of any stock market index is precisely proportionate to the performance of the index’s constituent stocks. In layman’s words, if the prices of the stocks in an index rise, the index as a whole rises as well.
- Segment index
Segment index is the classification of stocks based on their industries index.
Visuals
- Scroller
- Line chart
- Stacked column chart
- Stacked bar chart
- Text filter (search bar)
- Slicer
- Button (next page, clear all slicers)
PAGE 2: Stock Analysis
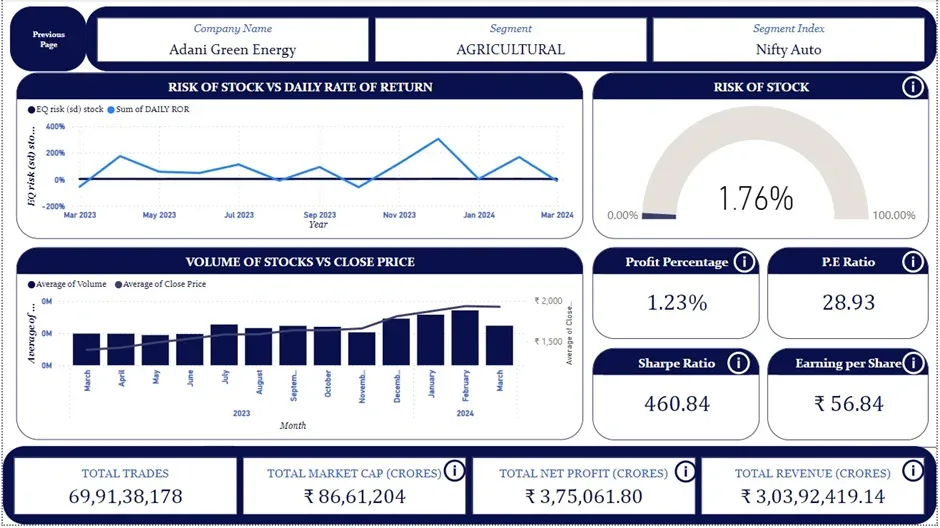
This page provides necessary information about a selected stock. This helps investors to determine whether they need to invest or not by easily analyzing provided crucial information.
- Profit Percentage
Profit margin is a common measure of the degree to which a company or a particular business activity makes money. Expressed as a percentage, it represents the portion of a company’s sales revenue that it gets to keep as a profit, after subtracting all of its costs.
- P.E Ratio
The price-to-earnings (P/E) ratio measures a company’s share price relative to its earnings per share (EPS). Often called the price or earnings multiple, the P/E ratio helps assess the relative value of a company’s stock. It’s handy for comparing a company’s valuation against its historical performance, against other firms within its industry, or the overall market.
KEY TAKEAWAYS
- The price-to-earnings (P/E) ratio is the proportion of a company’s share price to its earnings per share.
- A high P/E ratio could mean that a company’s stock is overvalued or that investors expect high growth rates.
- Companies with no earnings or are losing money don’t have a P/E ratio because there’s nothing to put in the denominator.
- The two most used P/E ratios are forward and trailing P/E.
- P/E ratios are most valuable when comparing similar companies in the same industry or for a single company over time.
- Sharpe Ratio
The Sharpe ratio compares the return of an investment with its risk. It’s a mathematical expression of the insight that excess returns over a period of time may signify more volatility and risk, rather than investing skill.
KEY TAKEAWAYS
- The Sharpe ratio divides a portfolio’s excess returns by a measure of its volatility to assess risk-adjusted performance
- Excess returns are those above an industry benchmark or the risk-free rate of return
- The calculation may be based on historical returns or forecasts
- A higher Sharpe ratio is better when comparing similar portfolios.
- The Sharpe ratio has inherent weaknesses and may be overstated for some investment strategies.
- EPS
Earnings per share (EPS) is a company’s net income subtracted by preferred dividends and then divided by the average number of common shares outstanding. The resulting number serves as an indicator of a company’s profitability. It is common for a company to report EPS that is adjusted for extraordinary items and potential share dilution.
The higher a company’s EPS, the more profitable it is considered to be.
KEY TAKEAWAYS
- Earnings per share (EPS) is a company’s net income subtracted by preferred dividends and then divided by the number of common shares it has outstanding.
- EPS indicates how much money a company makes for each share of its stock and is a widely used metric for estimating corporate value.
- A higher EPS indicates greater value because investors will pay more for a company’s shares if they think the company has higher profits relative to its share price.
- EPS can be arrived at in several forms, such as excluding extraordinary items or discontinued operations, or on a diluted basis.
- Like other financial metrics, earnings per share is most valuable when compared against competitor metrics, companies of the same industry, or across a period.
Page 3: Stock Calculator
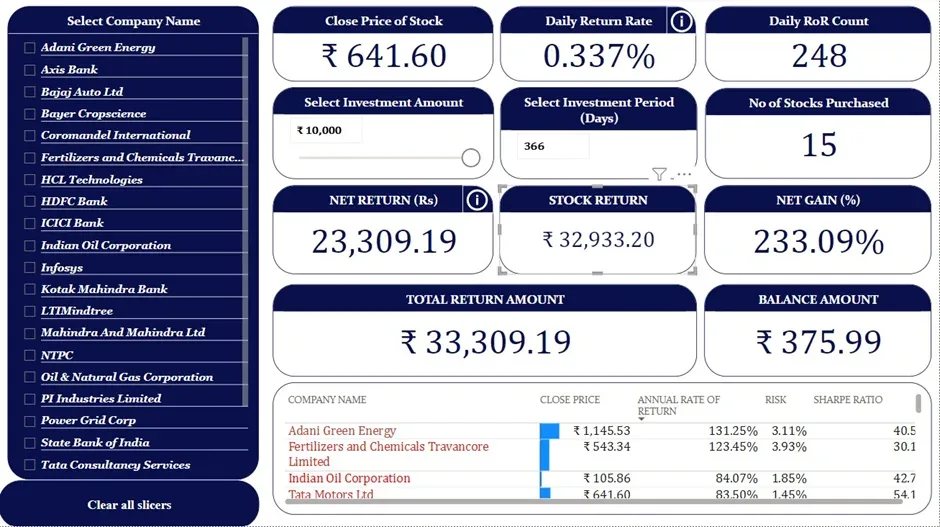
- Objective:
User will be able to input their investment amount and period of investment and see their estimated return in the selected period for each stock
Calculations
- Cash Balance- Balance of Cash available after buying the maximum number of shares at a given share price
- Total Amount- Adding Return Amount and Cash Balance
- Net Returns- Difference between Total Amount and Investment Amount
- Net Gain- Percentage Expression of Net Returns
- No of Stocks Traded- Maximum Number of stocks that can be purchased with the current Investment Amount
Page 4: Nifty index analysis
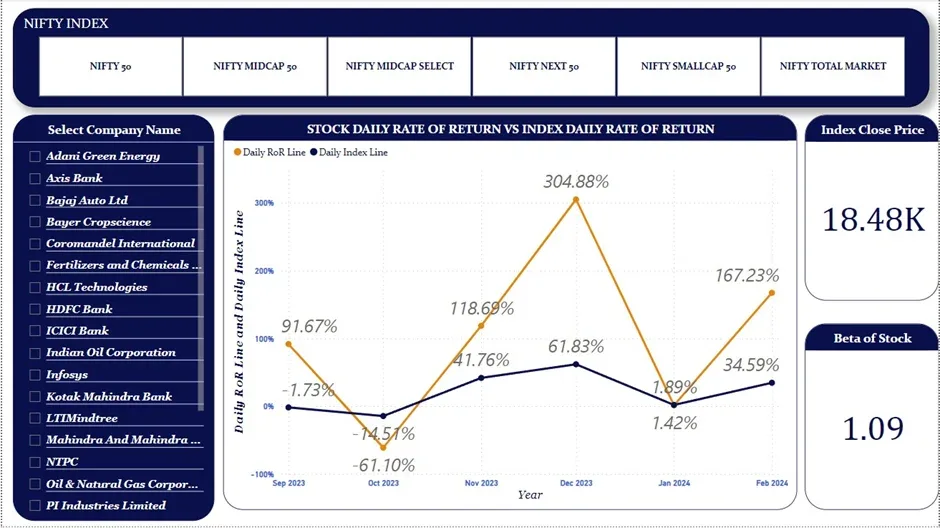
The main objective of the page is to compare stock with its market or index. The comparison is on the basis of Beta.
- Beta Stock
Beta is a measure of a stock’s volatility in relation to the overall market. By definition, the market, such as the S&P 500 Index, has a beta of 1.0, and individual stocks are ranked according to how much they deviate from the market. A stock that swings more than the market over time has a beta above 1.0. If a stock moves less than the market, the stock’s beta is less than 1.0.
KEY TAKEAWAYS
- Beta is a concept that measures the expected move in stock relative to movements in the overall market.
- A beta greater than 1.0 suggests that the stock is more volatile than the broader market, and a beta less than 1.0 indicates a stock with lower volatility.
- Beta is a component of the Capital Asset Pricing Model, which calculates the cost of equity funding and can help determine the rate of return to expect relative to perceived risk.
- Critics argue that beta does not give enough information about the fundamentals of a company and is of limited value when making stock selections.
- Beta is probably a better indicator of short-term rather than long-term risk.
Page 5: Nifty Sectoral Analysis
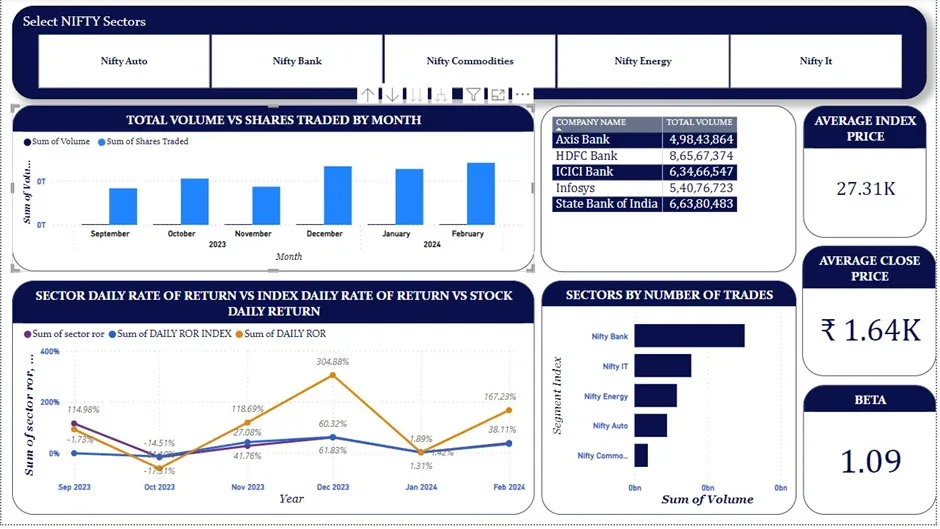
This page is used to compare stock with its market and its sectors. The main objective of this page is to find out how is stock movement related to its market and its segment. This comparison is based on Beta.
PAGE 6: IPO ANALYSIS
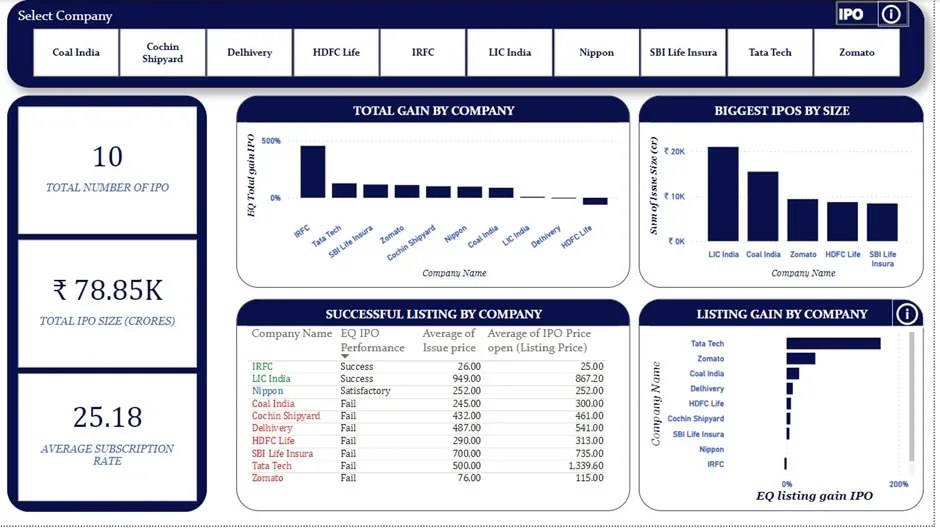
The main objective of this page is to compare IPOs of different companies based on their performance.
- IPO
An IPO is an initial public offering, in which shares of a private company are made available to the public for the first time. An IPO allows a company to raise equity capital from public investors.
The transition from a private to a public company can be an important time for private investors to fully realize gains from their investment as it typically includes a share premium for current private investors. Meanwhile, it also allows public investors to participate in the offering.
KEY TAKEAWAYS
- An initial public offering (IPO) refers to the process of offering shares of a private corporation to the public in a new stock issuance.
- Companies must meet requirements by exchanges and the Securities and Exchange Commission (SEC) to hold an IPO.
- IPOs provide companies with an opportunity to obtain capital by offering shares through the primary market.
- Companies hire investment banks to market, gauge demand set the IPO price and date, and more.
- An IPO can be seen as an exit strategy for the company’s founders and early investors, realizing the full profit from their private investment.
CALCULATIONS
- Daily RoR– Daily RoR typically refers to the “Daily Rate of Return” in finance and investing. It’s a measure used to calculate the profit or loss of an investment over a single day. The formula for daily rate of return can be expressed as:
- Daily ROR= (Current Close Price−Previous Close Price)/Previous Close Price
- The result is usually expressed as a decimal or percentage.
- Risk (SD): “Risk” or “Standard Deviation (SD) of a stock” refers to the measurement of the volatility or variability of the stock’s returns over a certain period. It is a statistical measure that helps investors assess the potential variability in returns and the associated risk of an investment. The formula for risk of return can be expressed as:
- Risk (SD)= SQRT(Variance)
- Where Variance= VAR.P (Column: Daily RoR)
- Investors often use standard deviation as a key metric in portfolio analysis to understand the risk associated with individual stocks or the entire portfolio. It helps investors assess the potential downside or upside risk of an investment based on historical return patterns.
- The result is usually expressed as a decimal or percentage.
- Beta: The “beta” of a stock is a measure of its sensitivity to market movements, specifically to movements in a benchmark index such as the Nifty Realty. It is a key concept in finance used to assess the systematic risk (or market risk) of a stock relative to the overall market. The formula for risk of return can be expressed as:
- Beta of Stock X=Covariance (Rx, Rm) /Variance (Rm)
- Where Rx= Daily RoR of Stock, Rm=Daily RoR of Market Index
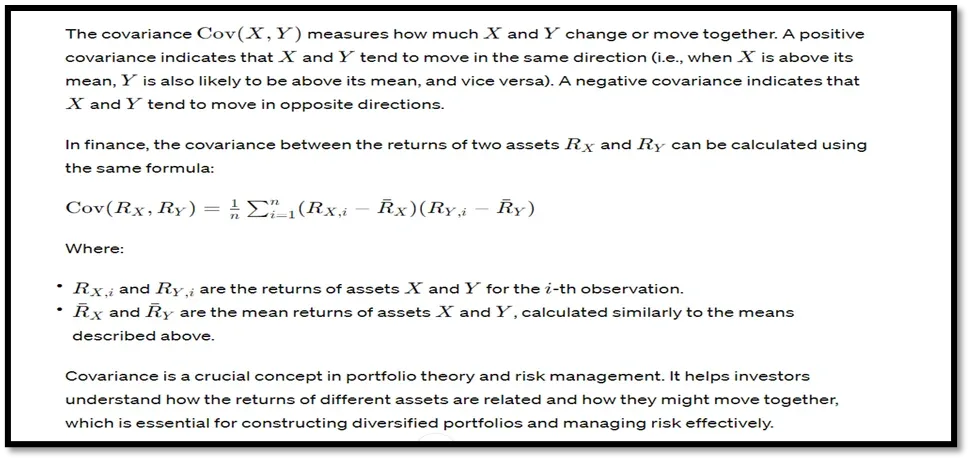
- Covariance=

Interpreting beta:
- β>1: The stock is more volatile than the market. It tends to magnify market movements.
- β=1: The stock moves in line with the market.
- β<1: The stock is less volatile than the market.
- Sharpe Ratio: a valuable tool for comparing different investments or portfolios and evaluating their performance in relation to risk. It helps investors and fund managers make informed decisions about asset allocation and risk management. Keep in mind that the Sharpe Ratio is based on historical data and assumptions about future returns and risk may vary. The formula to calculate the Sharpe Ratio:
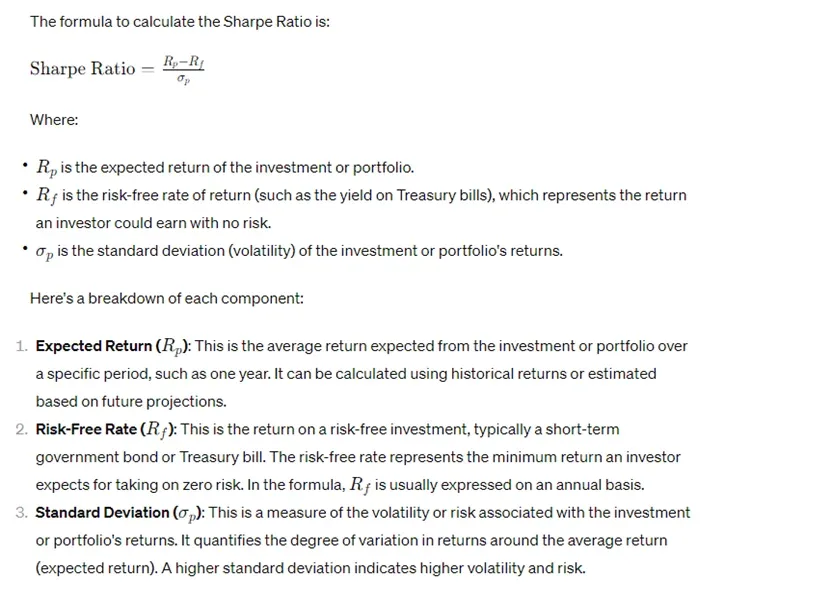
Interpreting the Sharpe Ratio:
- A higher Sharpe Ratio indicates a better risk-adjusted return, as it signifies more excess return per unit of risk.
- A Sharpe Ratio greater than 1 is generally considered good, indicating that the investment or portfolio is delivering excess return relative to the risk taken.
- A Sharpe Ratio of less than 1 suggests that the investment or portfolio may not be adequately compensating for the level of risk involved.
Annual RoR-It is the Actual Rate of Return of stock for the current analysis period. It is the sum of Dividend Yield and Annual RoR (Sum of Daily RoR).
No of Shares- It is the maximum number of shares that can be bought with the investment amount.
Mutual funds are like big pots of money managed by professionals who invest in different things like stocks, bonds, or other assets. While investment in mutual funds is subjected to market risk one should evaluate the risk before investing. If you understand the market and its risks, mutual funds can become your best investment option to grow money multifold. Whether you are going for short-term investments or long-term, you can create a mutual fund portfolio based on your preferences. The following page provides information that helps the user to select options in mutual funds that minimize risks and maximize returns.

Resource Gathering and Extraction
- For Daily Market Reports of Mf: NSE Website: https://www.moneycontrol.com/
- For Daily Market Reports of Nifty 500 TRI: NSE Website: https://www.nseindia.com/
- For Daily Market Reports of S&P BSE 500 TRI: NSE Website: https://www.bseindia.com/
- For Daily Market Report of Nifty 5 year SDL: NSE Website: https://www.nseindia.com/
- For Information About The Companies: https://www.moneycontrol.com/
All information and calculations are based on original market data analysis. The following sites are used for data extraction of various mutual fund schemes. All the above data were downloaded in cvs/text formats and copied to a single Excel sheet and each data was converted to table format for convenience. The period considered for Analysis of Daily Market Report: 1- Sep -2023 to 1- Mar-2024
Visualizations
Page1: MF Portfolio
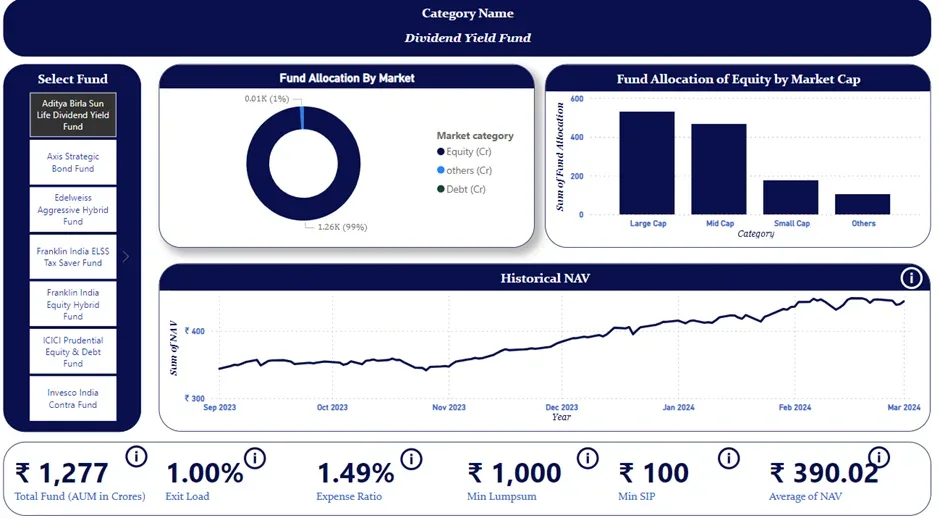
- Objective:
Users can Select the Mutual Funds and see the expenses, price, min SIP, and min Lumpsum amount. Users can understand the fund allocation from the graphs and can also see the price variations of MF in the line graph.
- Visuals
- Slicer– For Filtering each Mutual Funds MultiCard- For showing Exit load, Total Fund, Expense Ratio, Min Lumpsum, Min SIP, and Average price (NAV).Line graph- Historical NAV between the period of 6-sep-2023 to 1-mar-2024Pie Chart- Showing the allocation of fund between equity, debt, and others.
- Bar Chart– Fund Allocation between Market Caps.
Page 2: MF Holdings
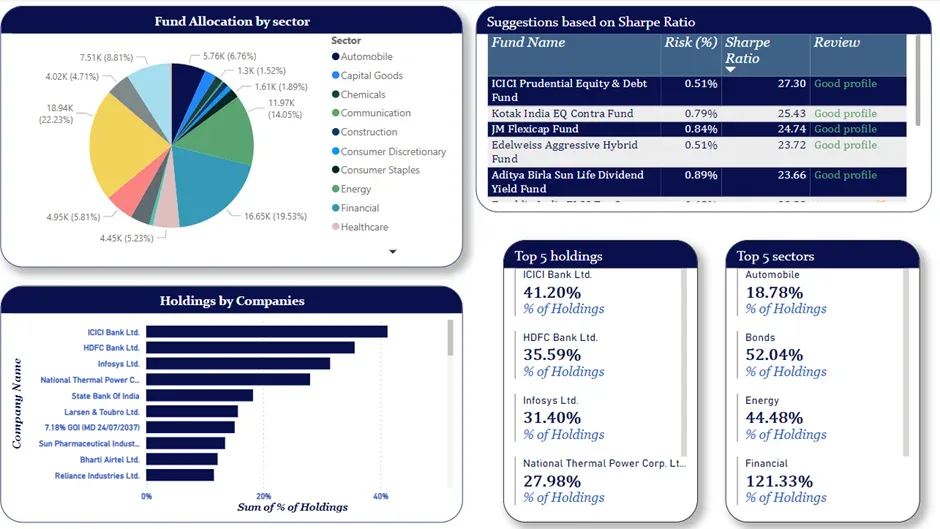
- Objective:
Users can see the fund allocation by market, Suggestions based on sharpe ratio, and Holdings by different companies.
- Visuals
- Clustered Bar chart- For displaying holdings by companiesPie Chart-For displaying fund allocation by sectorsTable- For displaying risk, Sharpe ratio, Suggestion
- Multi-Row cards- For showing top holdings and top sectors invested in the MF
- Calculations
- Risk (SD): “Risk” or “Standard Deviation (SD) of a stock” refers to the measurement of the volatility or variability of the stock’s returns over a certain period. It is a statistical measure that helps investors assess the potential variability in returns and the associated risk of an investment. The formula for risk of return can be expressed as:
- Risk (SD)= SQRT(Variance)
- Where Variance= VAR.P (Column: Daily RoR)
- Investors often use standard deviation as a key metric in portfolio analysis to understand the risk associated with individual stocks or the entire portfolio. It helps investors assess the potential downside or upside risk of an investment based on historical return patterns.
- The result is usually expressed as a decimal or percentage.
- Sharpe Ratio: a valuable tool for comparing different investments or portfolios and evaluating their performance in relation to risk. It helps investors and fund managers make informed decisions about asset allocation and risk management. Keep in mind that the Sharpe Ratio is based on historical data and assumptions about future returns and risk may vary. The formula to calculate the Sharpe Rati
- Interpreting the Sharpe Ratio:
- A higher Sharpe Ratio indicates a better risk-adjusted return, as it signifies more excess return per unit of risk.
- A Sharpe Ratio greater than 1 is generally considered good, indicating that the investment or portfolio is delivering excess return relative to the risk taken.
A Sharpe Ratio less than 1 suggests that the investment or portfolio may not be adequately compensating for the level of risk involved

Page 3: MF Maturity wise Returns
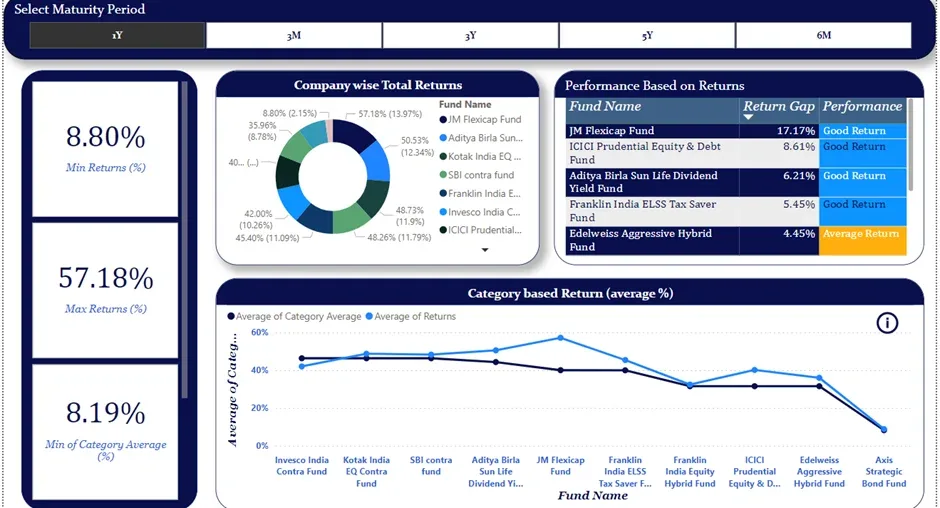
Objective:
Users can select the maturity period of mutual fund. User can understand the company wise returns, performance of each MF, Comparison between the category average and average return of each MF, Min returns, and Max Returns.
- Visuals
- Slicer- For Filtering the maturity period
- Multi-Card– For showing Max returns, Min returns, Min Category Average
- Line graph- For showing a comparison between category average and total average
- Pie Chart- For showing company wise returns
- Table –For showing performance using return gap.
- Calculations
3_MF_Performance = R>0.05, Good Return, R<0.05 Average Return, R>0.02, Low Return
Page 4 : MF Return Analysis
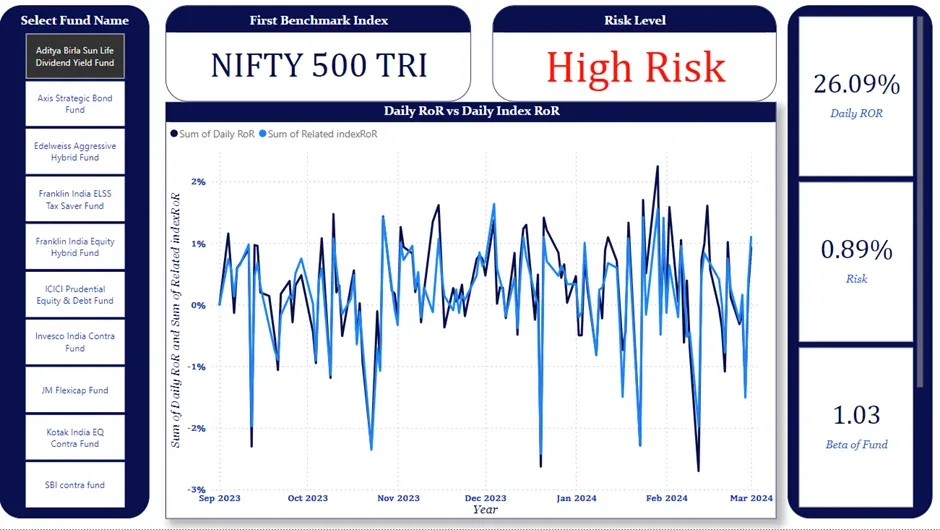
Objective:
Users can select the Mutual Funds. Users can understand about the benchmark index, risk level, daily rate of return of each fund, the risk involved, and comparison between the daily rate of return and daily index rate of return.
- Visuals
- Slicer- For Filtering company names.Multi-Card– For showing Daily RoR, Risk, and Beta of FundLine graph- For showing a comparison between Daily RoR and Daily Index RoR
- Card –For showing benchmark index and risk level.
- Calculations
- Risk (SD): “Risk” or “Standard Deviation (SD) of a stock” refers to the measurement of the volatility or variability of the stock’s returns over a certain period. It is a statistical measure that helps investors assess the potential variability in returns and the associated risk of an investment. The formula for risk of return can be expressed as:
- Risk (SD)= SQRT(Variance)
- Where Variance= VAR.P (Column: Daily RoR)
- Risk (SD): “Risk” or “Standard Deviation (SD) of a stock” refers to the measurement of the volatility or variability of the stock’s returns over a certain period. It is a statistical measure that helps investors assess the potential variability in returns and the associated risk of an investment. The formula for risk of return can be expressed as:
- Investors often use standard deviation as a key metric in portfolio analysis to understand the risk associated with individual stocks or the entire portfolio. It helps investors assess the potential downside or upside risk of an investment based on historical return patterns.
- The result is usually expressed as a decimal or percentage.
- Beta: The “beta” of a stock is a measure of its sensitivity to market movements, specifically to movements in a benchmark index such as the Nifty Realty. It is a key concept in finance used to assess the systematic risk (or market risk) of a stock relative to the overall market. The formula for risk of return can be expressed as:
- Beta of Stock X=Covariance (Rx, Rm) /Variance (Rm)
- Where Rx= Daily RoR of Stock, Rm=Daily RoR of Market Index
- Covariance=

Interpreting beta:
- β>1: The stock is more volatile than the market. It tends to magnify market movements.
- β=1: The stock moves in line with the market.
- β<1: The stock is less volatile than the mark
- Daily RoR= The daily rate of return for mutual funds can vary depending on the performance of the underlying assets within the fund. To calculate the daily rate of return for a mutual fund, you can use the following formula:
- Daily Rate of Return=(Ending NAV−Beginning NAVBeginning NAV)×100%Daily Rate of Return=(Beginning NAVEnding NAV−Beginning NAV)×100%
- Where:
- “Ending NAV” is the Net Asset Value of the fund at the end of the day.
- “Beginning NAV” is the Net Asset Value of the fund at the beginning of the day.
- This formula calculates the percentage change in the NAV from the beginning of the day to the end of the day. It’s important to note that this calculation doesn’t take into account any fees or expenses associated with the mutual fund. Also, mutual funds often report their returns on a monthly or quarterly basis rather than daily, but you can still use this formula to calculate daily returns if you have access to the necessary data.
- Daily Intex RoR= The daily index rate of return refers to the percentage change in the value of an index from one day to the next. To calculate the daily rate of return for an index, you can use the following formula:
- Daily Rate of Return=(Ending Index Value−Beginning Index ValueBeginning Index Value)×100%Daily Rate of Return=(Beginning Index ValueEnding Index Value−Beginning Index Value)×100%
- Where:
- “Ending Index Value” is the value of the index at the end of the day.
- “Beginning Index Value” is the value of the index at the beginning of the day.
- This formula calculates the percentage change in the index value from the beginning of the day to the end of the day. It’s important to note that the calculation of index returns typically doesn’t include dividends or other distributions.
- For some indexes, especially those like total return indexes that include dividends, the calculation can be a bit more complex. In such cases, the daily return would also account for any dividends or distributions during that day.
Page 5: MF Lump sum Calculator
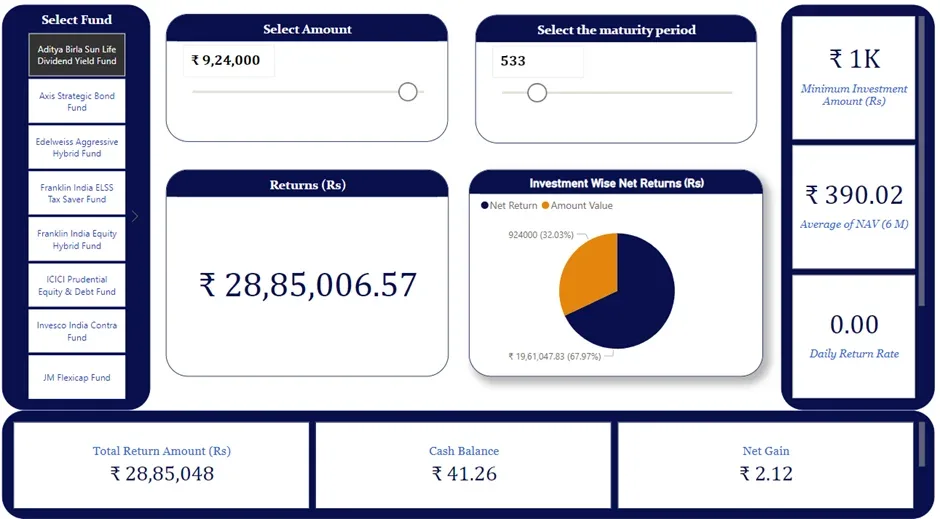
Objective:
Users can select the Mutual Funds. Users can also select the amount which they need to invest and the time period. The user gets the Lumpsum Returns amount along with other calculations related to it.
- Visuals
- Slicer- For Filtering company names.Multi-Card– For showing investments and returns.Pie Chart –For showing investment-wise returns.
- Parameters- For selecting the investment amount and for selecting the maturity period.
- Calculations
- Net Gain = Net gain refers to the overall profit realized from an investment or a financial transaction after considering all associated costs, fees, taxes, and other expenses. It’s essentially the difference between the total amount received from an investment and the total amount initially invested.The formula to calculate the net gain is:
- Net Gain=Total Amount Received−Total Amount InvestedNet Gain=Total Amount Received−Total Amount Invested
- Net Return = Net return refers to the overall gain or loss realized from an investment or a financial transaction after considering all associated costs, fees, taxes, and other expenses, typically expressed as a percentage of the initial investment.
- The formula to calculate the net return as a percentage is:Net Return (%)=(Net GainInitial Investment)×100%Net Return (%)=(Initial InvestmentNet Gain)×100%Or, alternatively, if you have the final value of the investment:
- Net Return (%)=(Final Value−Initial InvestmentInitial Investment)×100%Net Return (%)=(Initial InvestmentFinal Value−Initial Investment)×100%
- Total Return amount = Return + cash balance
- Cash Balance= It is the remaining amount after dividing the invested amount with NAV
Page 6: MF SIP Calculator
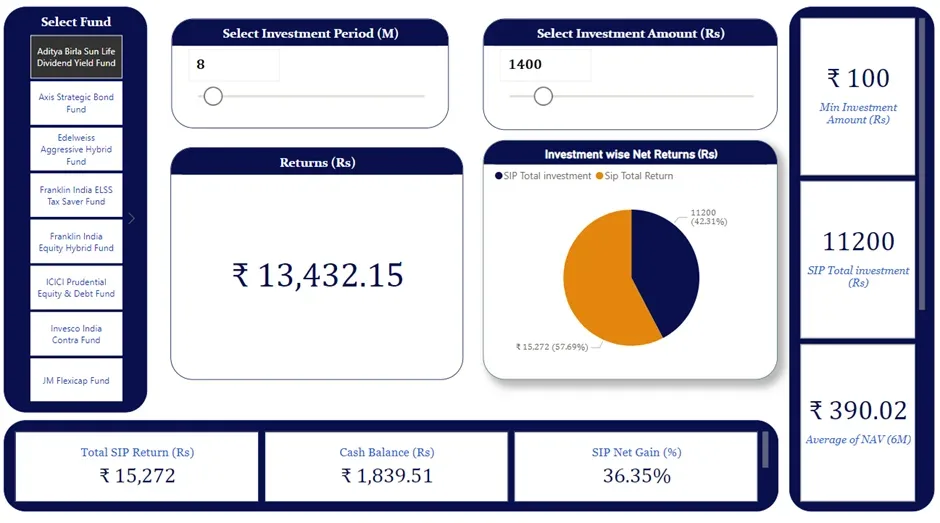
Objective:
User can Select the Mutual Funds. Users can also select the amount which he needs to invest and the time period.User gets the SIP Returns amount along with other calculations related to it.
- Visuals
- Slicer- For Filtering company names.
- Multi-Card– For showing investments and returns.
- Pie Chart –For showing investment wise returns.
- Parameters- For selecting the investment amount and for selecting the maturity period.
- Calculations
- SIP Net Gain = Net gain refers to the overall profit realized from an investment or a financial transaction after considering all associated costs, fees, taxes, and other expenses. It’s essentially the difference between the total amount received from an investment and the total amount initially invested.
- The formula to calculate the net gain is:
- Net Gain=Total Amount Received−Total Amount InvestedNet Gain=Total Amount Received−Total Amount Invested
- SIP Net Return= Net return refers to the overall gain or loss realized from an investment or a financial transaction after considering all associated costs, fees, taxes, and other expenses, typically expressed as a percentage of the initial investment.
- The formula to calculate the net return as a percentage is:
- Net Return (%)=(Net GainInitial Investment)×100%Net Return (%)=(Initial InvestmentNet Gain)×100%
- Or, alternatively, if you have the final value of the investment:
- Net Return (%)=(Final Value−Initial InvestmentInitial Investment)×100%Net Return (%)=(Initial InvestmentFinal Value−Initial Investment)×100%
- SIP Total Return amount= Return + cash balance
- Cash Balance= It is the remaining amount after dividing the invested amount with NAV
BONDS
Bonds are a type of investment where you lend money to a company, government, or other entity for a specific period of time in exchange for regular interest payments and the return of the initial amount, known as the principal, at the end of the bond’s term. bonds provide investors with a way to earn regular income through interest payments while preserving their capital. They can be an essential part of a diversified investment portfolio, offering stability and income potential. Following pages provides information about investing in bonds.

Resource Gathering and Extraction
- For Daily Market Reports of Stock: NSE Website: https://www.nseindia.com/
- For Daily Market Reports of Index: NSE Website: https://www.nseindia.com/
- For Bonds and its Details : Fixed income website: https://www.thefixedincome.com/
- For Bonds and its Details : Fixed income website : https://www.indiabonds.com/
All information’s and calculations are based on original market data analysis. The following sites are used to extract current market data regarding bonds. All the above data were downloaded in cvs/text formats and copied to single excel sheet and each data was converted to table format for convenience. The period considered for Analysis of Daily Market Report: 6- March-2023 to 5- Mar-2024
Visualizations
Page 1: Bond Details
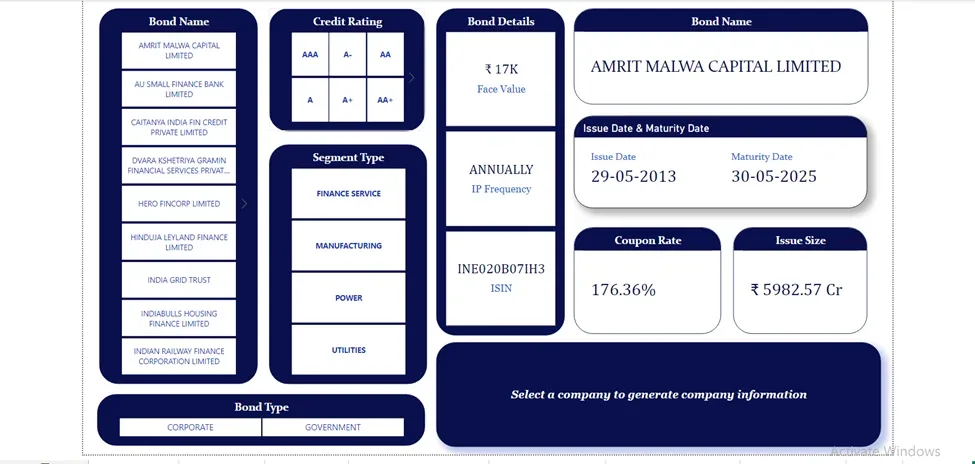
Objective:
In this page the user can easily gain the basic information about the given bonds details.
Tables:
- Bond details
Visuals:
- Slicer – for filtering the bond type, segment type and the bond name
- Card(new) – for showing the basic details of the selected bonds
Page 2: Daily Report
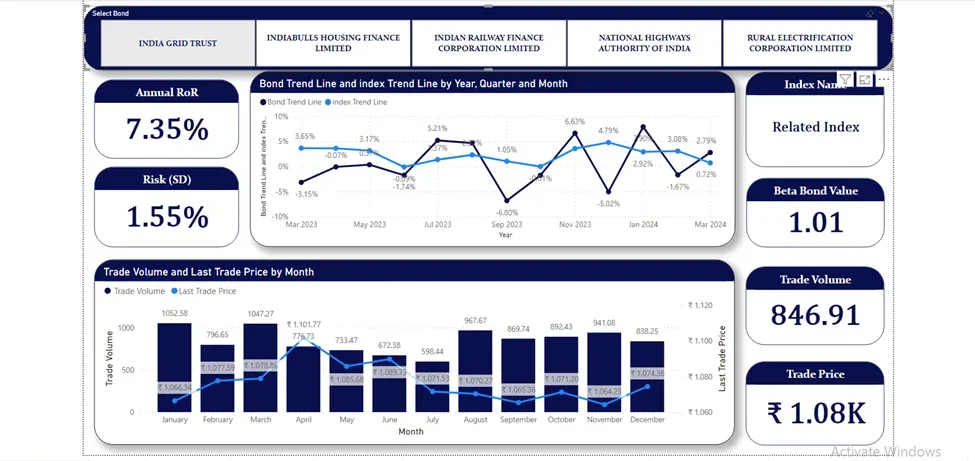
Objective: It is used know the daily changes of rate of return of each bond and they can compare the volume traded for each bond compared with the late traded price also the users should be able to see the important financial measures like beta and the risk of bond alone with the comparison of bond with its index trend line.
Tables:
- Bond details
- Daily report
- Date table
- Index table
Visuals:
Slicer – for filtering each bonds
Card – for showing the filtered bonds details
Lie chart – for displaying the bond trend line and index trend line and also show the comparison between them
Line and Clustered column chart – for displaying the trade volume and last trade price
Calculations:
- Risk(SD) – “Risk” or “Standard Deviation (SD) of a stock” refers to the measurement of the volatility or variability of the stock’s returns over a certain period. It is a statistical measure that helps investors assess the potential variability in returns and the associated risk of an investment
- Beta – The “beta” of a stock is a measure of its sensitivity to market movements, specifically to movements in a benchmark index such as the Nifty Realty. It is a key concept in finance used to assess the systematic risk (or market risk) of a stock relative to the overall market.
Page 3: Rating Report
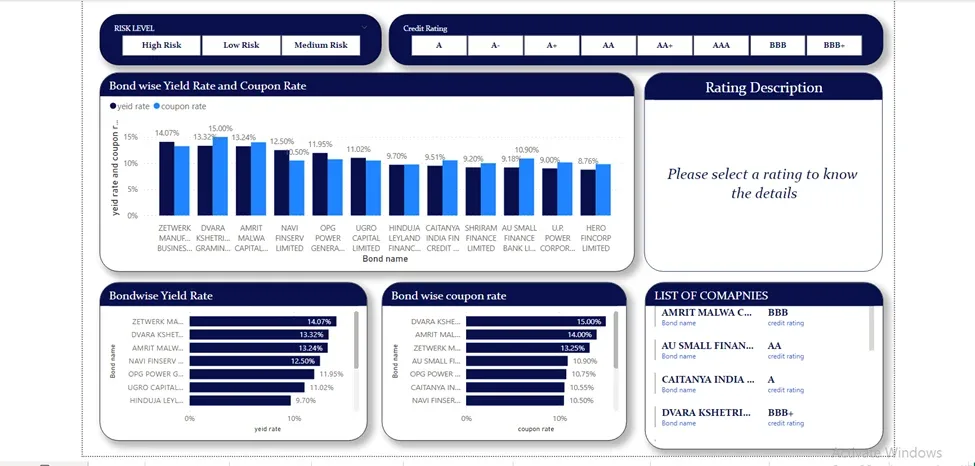
Objective: The user will be able to select the risk level and understand how each credit rating explains the risk level of each bond by clicking on a single credit rating the user is able to understand all stocks that are available in the particular rating and its related description. The user can also see the comparison of the yield and coupon rate of each bond in this page
Visuals:
- Slicer – for sorting the risk level and for the credit rating
- Card – It displays the details about selected credit rating
- Clustered Column chart –It is used to compare yield rate and coupon rate by using bond names
- Stacked bar chart – It is used to show yield rate and coupon rate specifically by using the bond names
- Multi-row card – it is for displaying the list of bond companies
Calculations:
- Description – it is the description of the credit rating
Page 4: Bond Comparison
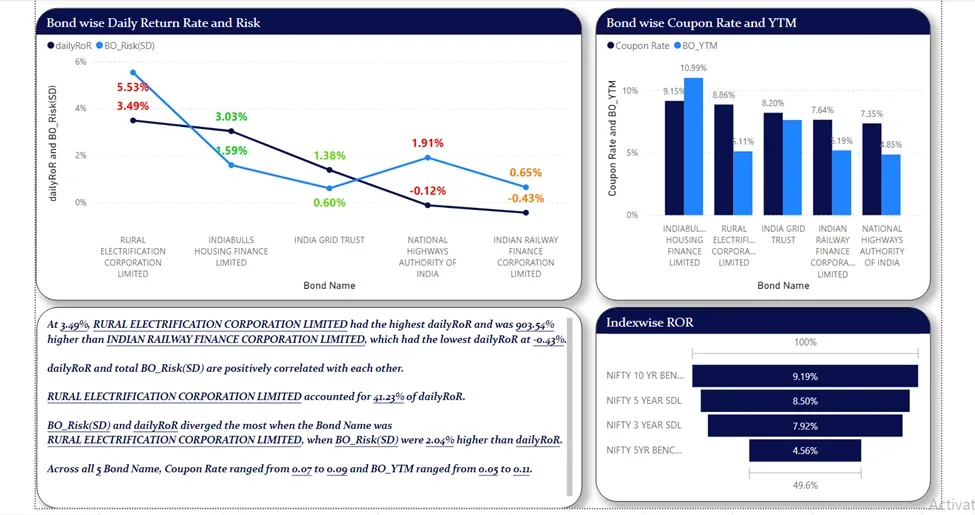
Objective: The page displays the comparison between the return and risk of each bond and the yield to maturity and coupon rate of each bond and the user will be able to differentiate between different levels of index that is used for each bond based on the maturity period.
Visuals:
- Line chart – It is the comparison of risk(SD) and the daily rate of return by using bond names
- Clustered Column chart –It shows the comparison of yield to maturity and coupon rate by bond name
- Funnel – It displays the index rate of return by the using of index name
- Smart narrative – auto explanation of data (AI visual)
Calculations:
- Risk(SD) –Risk or “Standard Deviation (SD) of a stock” refers to the measurement of the volatility or variability of the stock’s returns over a certain period. It is a statistical measure that helps investors assess the potential variability in returns and the associated risk of an investment.
- Yield to maturity(YTM) –Yield to maturity (YTM) is a financial term used to describe the total return anticipated on a bond if the bond is held until it matures. It’s essentially the internal rate of return (IRR) of an investment in a bond if the investor holds the bond until maturity and reinvests all coupon payments at the same rate. YTM takes into account the bond’s current market price, its face value, the coupon interest rate, and the time remaining until maturity.
Page 5: Bond Return Calculator

Objective: The user will be able to select amount and see how much value return. we can get at the end of maturity period based on the amount in hand for each bond.
Visuals:
- Slicer –It is used to select the bond name and the amount to calculate the return
- Card –It shows the face value, coupon rate, frequency, coupon amount, and gain and mainly shows the return amount that we selected in the slicer
Calculations:
- Years – Number of year for maturity
- Coupon amount – The coupon amount in a bond refers to the fixed interest payment that the issuer of the bond promises to pay to the bondholder at regular intervals until the bond matures. This payment is usually expressed as a percentage of the bond’s face value and is typically paid semi-annually or annually.
- Gain – Gains in bonds can enhance the total return on investment for bondholders, alongside coupon payments and potential interest rate changes. Conversely, if a bond is sold for less than its purchase price, it results in a capital loss for the investor.
- Return amount –The return amount reflects the total income and capital appreciation (or depreciation) generated by holding the bond for a specific period. It’s an important metric for bond investors to assess the performance and profitability of their bond investments.
Page 6: Future Calculations
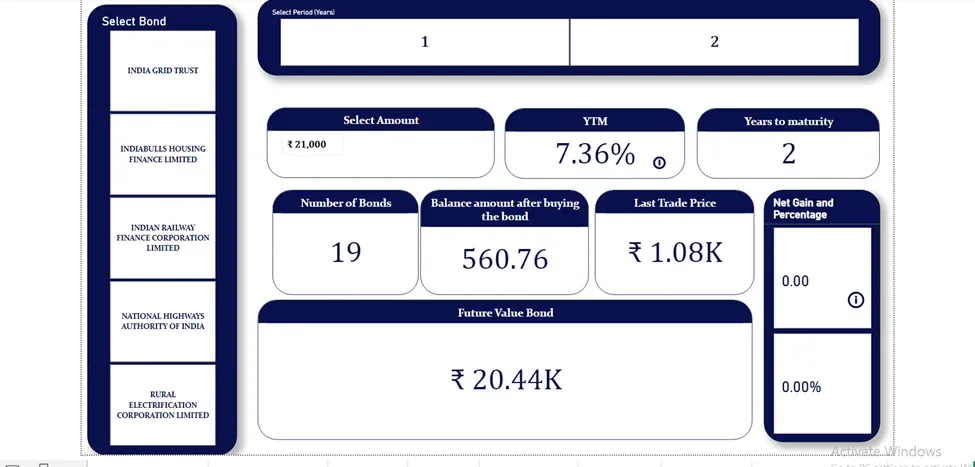
Objective: The user doesn’t want to hold the bond under maturity. He can see the amount of return he will get by selecting the number of period he wants to hold and the amount has in his hand. The user will also be able to see the number of bonds he has purchased and the percentage of gain he earn after the investment period.
Visuals:
- Slicer – It is used for selecting bond names and filter the amount and period(year) to find the future return
- Card – for showing how much number of bonds which we bought by selecting the amount in the slicer. It gives the ‘balance amount after buying the bond and show the last trade price, yield to maturity, years to maturity by sorting amount, period(year)and bond name in the given slicer.
- Card (new) – it shows the net gain and the percentage of the net gain.
Calculations:
- Number of bonds – To show how many individual bonds you own.
- Balance amount after buying bond – To show the balance amount after buying the bond
- Yield to maturity – It’s like the “total return” you’d get from a bond if you held it until it matures, factoring in its price, interest payments, and the time until maturity. It’s a way to measure how profitable a bond investment could be.
- Future value bond – The future value of a bond is like looking at how much money it will be worth later on, typically at the end of its term or maturity date. Think of it as predicting how much your investment in the bond will grow over time, including any interest payments or gains. So, it’s essentially estimating what the bond will be worth in the future if you hold onto it until it matures.
- Net gain – Net gain is the amount you’ve earned after subtracting any costs or losses from your total earnings. It’s like figuring out how much money you’ve actually made after considering all the expenses or deductions.
Page 7: Countrywise Report
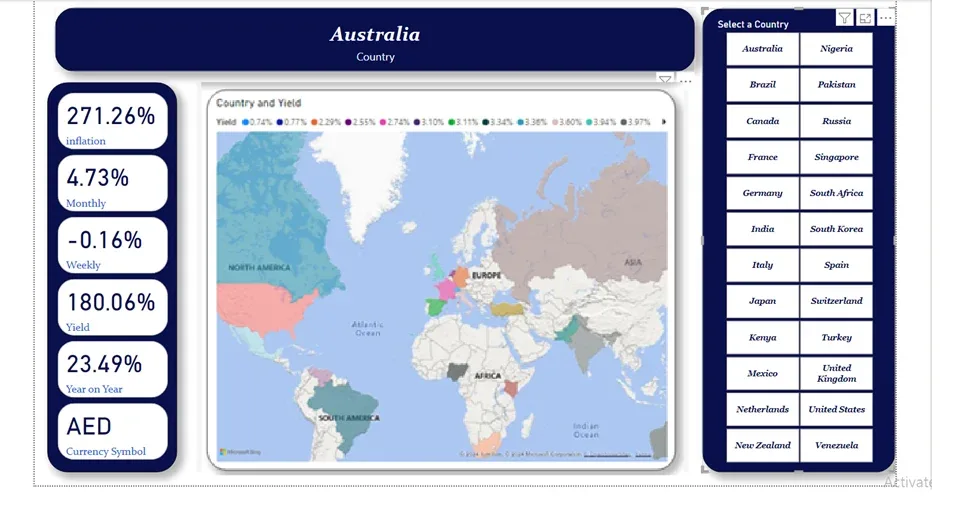
Objective:
To user will able to select and see the inflation and monthly differences of yield rate of each country when compare at an international level
Visuals:
- Slicer –For filtering country names
- Card –For showing the country names
- Card(new) –It shows the inflation, yield, currency symbol
- Filled map – It displays the selected country locations
Reits and Invits
Real Estate Investment Trusts (REITs) and Infrastructure Investment Trusts (InvITs) are both investment vehicles that allow individuals to invest in real estate and infrastructure assets respectively, without directly owning them. Both REITs and InvITs are regulated investment vehicles in many countries and offer investors the benefits of diversification, liquidity, and income potential associated with real estate and infrastructure investments. Following pages provide information about investing in REITs and InvITs.
Resource Gathering and Extraction
- For Daily Market Reports of Reits and Invit: NSE Website: https://www.nseindia.com/
- For Daily Market Reports of Nifty Realty: NSE Website: https://www.nseindia.com/
- For Current Company List of Nifty Realty: NSE Website: https://www.nseindia.com/
- For Annual Reports: Screener Stock Analysis- https://www.screener.in/
- Dividend History Data: https://www.moneycontrol.com/
All information and calculations are based on original market data analysis. The following sites are used to extract current market data regarding Reits and Invit. All the above data were downloaded in cvs/text formats and copied to a single excel sheet and each data was converted to table format for convenience. The period considered for Analysis of Daily Market Report: 6- March-2023 to 5- Mar-2024
Visualisations
Page 1: Trend Line
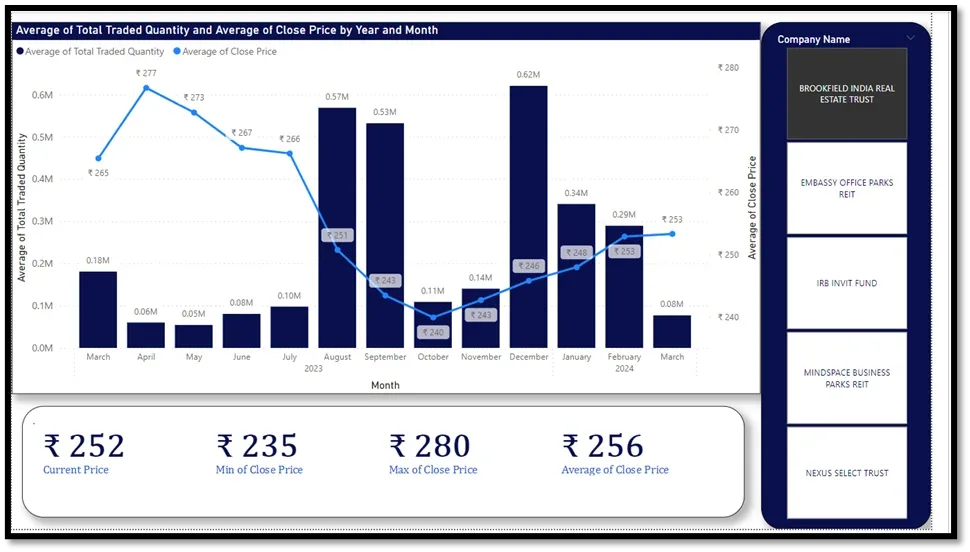
- Objective:
User can select each stock to know its price Vs Volume trend from March 2023 to Mar 2024. Users will be able to see and understand the relationship between the price and demand of each stock.
- Tables :
- Daily Market Reports
- Master Data
- Date Table
- Visuals
- Slicer- For Filtering each StockMulti-Card– For showing Current, Min, Max, and Average Price related data in the bottom.
- Line and Clustered Column Chart- For displaying Price-Volume Trend
- Measures
- None
Page 2: Stock Vs Market
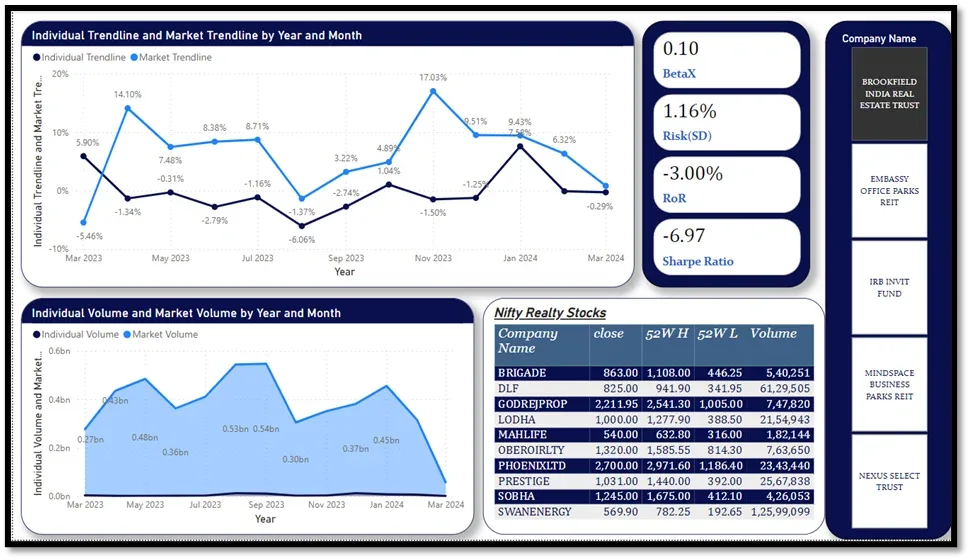
- Objective:
User can select each stock to know its daily Rate of Return (RoR) trend when compared to the daily Rate of Return of the Market or Index from March 2023 to Mar 2024. Users will be able to see and understand the relationship between the Return on Stock Vs the Return on the Market.
- Tables :
- Daily Market Reports
- Master Data
- Date Table
- Nifty Realty
- Nifty Indices CReport
- Visuals
- Slicer- For Filtering each StockCard (New)- For showing the Sharp Ratio, Beta, Risk, and Rate of Return of each StockLine Chart- For displaying RoR between the Trendline of Nifty Realty (Market) and the Stock TrendlineStacked Area Chart- For displaying the relative size of Market trade volume or transactions in comparison with Stock trade volume
- Table: For showing the list of stock in Nifty Realty and its current close price.
- Measures
- Daily RoR– Daily RoR typically refers to “Daily Rate of Return” in finance and investing. It’s a measure used to calculate the profit or loss of an investment over a single day. The formula for daily rate of return can be expressed as:
- Daily ROR= (Current Close Price−Previous Close Price)/Previous Close Price
- The result is usually expressed as a decimal or percentage.
- Daily RoR– Daily RoR typically refers to “Daily Rate of Return” in finance and investing. It’s a measure used to calculate the profit or loss of an investment over a single day. The formula for daily rate of return can be expressed as:
- Risk (SD): “Risk” or “Standard Deviation (SD) of a stock” refers to the measurement of the volatility or variability of the stock’s returns over a certain period. It is a statistical measure that helps investors assess the potential variability in returns and the associated risk of an investment. The formula for risk of return can be expressed as:
- Risk (SD)= SQRT(Variance)
- Where Variance= VAR.P (Column: Daily RoR)
- Investors often use standard deviation as a key metric in portfolio analysis to understand the risk associated with individual stocks or the entire portfolio. It helps investors assess the potential downside or upside risk of an investment based on historical return patterns.
- The result is usually expressed as a decimal or percentage.
- Beta: The “beta” of a stock is a measure of its sensitivity to market movements, specifically to movements in a benchmark index such as the Nifty Realty. It is a key concept in finance used to assess the systematic risk (or market risk) of a stock relative to the overall market. The formula for risk of return can be expressed as:
- Beta of Stock X=Covariance (Rx, Rm) /Variance (Rm)
- Where Rx= Daily RoR of Stock, Rm=Daily RoR of Market Index
- Covariance=
Interpreting beta:
- β>1: The stock is more volatile than the market. It tends to magnify market movements.
- β=1: The stock moves in line with the market.
- β<1: The stock is less volatile than the market.
- Sharpe Ratio: a valuable tool for comparing different investments or portfolios and evaluating their performance in relation to risk. It helps investors and fund managers make informed decisions about asset allocation and risk management. Keep in mind that the Sharpe Ratio is based on historical data and assumptions about future returns and risk may vary. The formula to calculate the Sharpe Ratio:

Interpreting the Sharpe Ratio:
- A higher Sharpe Ratio indicates a better risk-adjusted return, as it signifies more excess return per unit of risk.
- A Sharpe Ratio greater than 1 is generally considered good, indicating that the investment or portfolio is delivering excess return relative to the risk taken.
- A Sharpe Ratio less than 1 suggests that the investment or portfolio may not be adequately compensating for the level of risk involved.
3. Page: 3 Annual Info
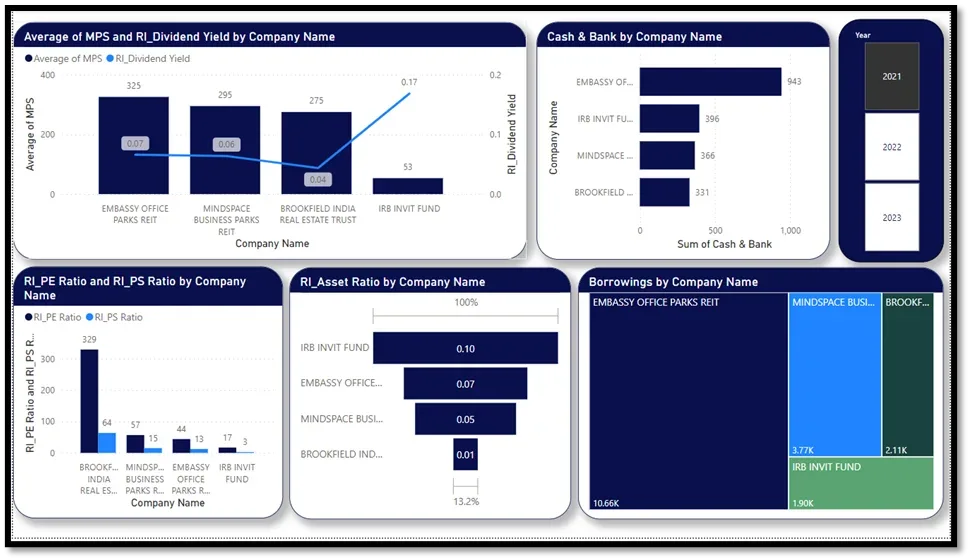
- Objective:
User can select the year and see and compare the different financial ratios and annual financial position of each stock. User will be able to make investing choices based on performance comparisons done on each stock.
- Tables:
- Annual Report
- Master Data
- Date Table
- Dividend History
- Visuals
- Slicer- For Filtering each year
- Line and stacked column Chart- For comparing Average MPS of each stock with its dividend yield in a year
- Clustered bar Chart- For comparing cash and bank balances of each stock in a year
- Clustered column Chart- For comparing PE ratio and PS Ratio of each stock in a year.
- Funnel Chart- For displaying Asset Ratio of each stock in descending order in a year.
- Treemap- For displaying the borrowings of each stock in a year
- Measures
- Dividend Yield- Dividend yield is a financial ratio that indicates the annual dividend income as a percentage of the current market price of a stock (MPS). It is a measure used by investors to assess the amount of income they are receiving relative to the price they paid for the stock.
- PE Ratio- The P/E ratio, or price-to-earnings ratio, is a commonly used financial metric that helps investors assess the valuation of a company’s stock by comparing its current share price (MPS) to its earnings per share (EPS).
- PS Ratio- The PS ratio, or price-to-sales ratio, is a financial metric used to evaluate the valuation of a company relative to its revenue (sales). It is calculated by dividing the market price of a company (MPS) by its revenue (sales) per share (SPS) over a specific period, typically the last 12 months.
- Asset Ratio- The total asset turnover ratio measures a company’s ability to generate revenue from its assets. It is calculated by dividing a company’s total sales (or revenue) by its average total assets.
Page 4: FV Calculator
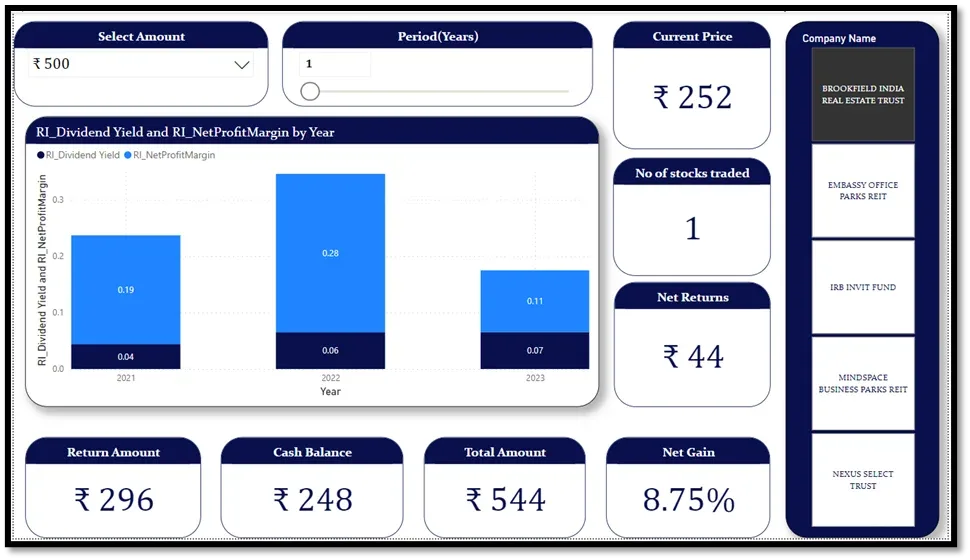
- Objective:
User will be able to input their investment amount and period of investment and see their estimated return in the selected period for each stock
- Tables:
- Master Data
- Dividend History
- Visuals
- Slicer- For Filtering each stock, Selecting Amount and period parameter.
- Stacked Column Chart- For comparing Net profit Margin and dividend yield of in all years of each stock
- Card- For displaying all the outputs that investor wants to know from selected inputs.
- Measures
- Return Amount (FV)- which represents the value of an investment at a specific future point in time, taking into account the initial principal amount, the rate of return (interest rate), and the time period over which the investment grows.
The future value (FV) can be calculated using the following formula for compound interest:
FV=P× (1+r) ^ n
Where:
FV = Future Value of the investment
P = Principal amount (initial investment)
r = Interest rate per compounding period (expressed as a decimal)
n = Number of compounding periods (time period over which the investment grows)
- Cash Balance- Balance of Cash available after buying the maximum number of shares at given share price
- Total Amount- Adding Return Amount and Cash Balance
- Net Returns- Difference between Total Amount and Investment Amount
- Net Gain- Percentage Expression of Net Returns
- No of Stocks Traded- Maximum Number of stocks that can be purchased with the current Investment Amount
Page 5: Expected Val Calculator
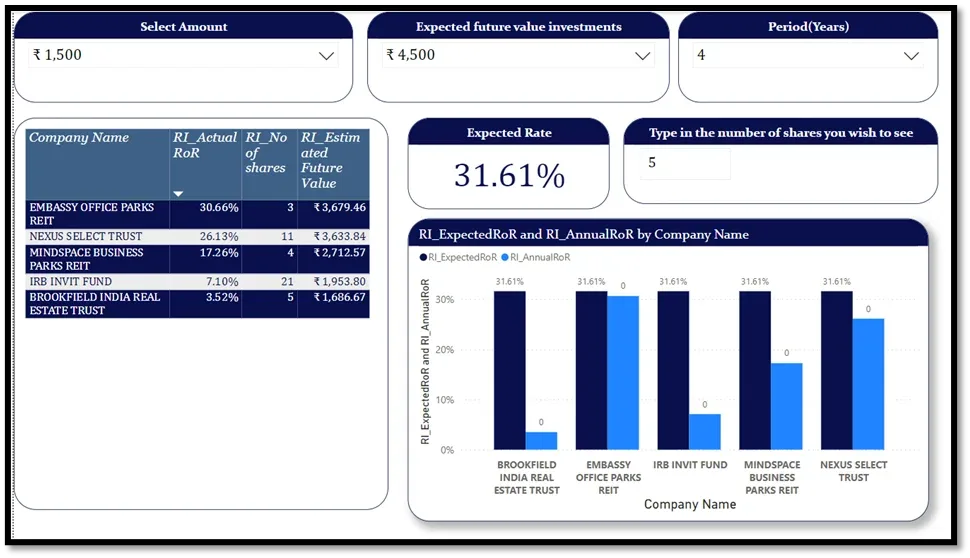
- Objective:
User will be able to input his investment amount, desired future value of investment and period of investment and will be able to see which all stocks will help him achieve a close target.
- Tables:
- Master Data
- Visuals
- Clustered Column Chart- For comparing Annual Rate of return and expected rate of return of each stock
- Card- For displaying all the outputs that investor wants to know from selected inputs.
- Table- For displaying the company name, its actual RoR, Future value and the number of shares that can be bought.
- Measures
- Expected Rate of Return (Expected RoR)- the rate formula is used to calculate the interest rate per period of an annuity or investment. The power bi function RATE is used to calculate Expected RoR.
- Annual RoR-It is the Actual Rate of Return of stock for the current analysis period. It is the sum of Dividend Yield and Annual RoR (Sum of Daily RoR).
- No of Shares- It is the maximum number of shares that can be bought with the investment amount.
- Estimated Future Value- It is the same concept as the Return Amount (FV) in the previous page.
- Ranking up-Ranking based on the difference between actual and expected RoR
Optimum Portfolio Generation
Choosing the best investment options for wealth management is an area of concern for people of all income groups. There are several long-term and short-term investment options that you can opt for, considering your goals and risk appetite. The user can select their preferred investment type to go into the details.

Based on “Efficient Portfolio Frontier” and “Modern Portfolio Theory” developed by Harry Markovitz
- Data Source: Excel File-OPG Plan– Please view the “Data Sheet” tab of the workbook for viewing calculations. As complex financial functions are used and power doesn’t support advance level calculations, most workings are done in the excel sheet. Columns Y to AK is the dataset uploaded to power BI.
- Data Gathering:
- The data used to prepare Optimum Portfolio Pages were taken from individual projects of Banks, Equity, Mutual Fund, Bonds and Reits. All information’s and calculations are based on original market data analysis.
- Each Individual project deals with different investment category and presented with specific number of options in their respective areas. From the list of our investment options, we have taken top 10 options which give the best return compared to its individual related risk.
- We have then taken a mix that would help in reducing the individual risk by creating a diversified portfolio which gives best returns.
- We have considered “Daily RoR” column from each investment for analysis of portfolio. Since Daily RoR is not available for all the listed investment options, we used “Annual RoR” as a substitute measure for the same.
- Here is a list of investments selected for Optimum Portfolio Generation:
| SL No | Name | Investment Type |
| 1 | Bajaj Auto | Equity |
| 2 | SBI | Equity |
| 3 | HCL Technologies | Equity |
| 4 | ICICI Prudential Equity and Debt Fund | Mutual Funds |
| 5 | JM FlexiCap Fund | Mutual Funds |
| 6 | Franklin India ELSS Tax Saver Fund | Mutual Funds |
| 7 | India Bull Housing Finance | Bonds |
| 8 | India Grid Trust | Bonds |
| 9 | Embassy Office Park Reits | Reits |
| 10 | Bank of Baroda | Fixed Deposits |
- Data Set Period: The Period range used for analysis starts from 01-09-2023 to 29-02-2024. (6 months or Semi-Annual)
Page 1: Portfolio Generator- General
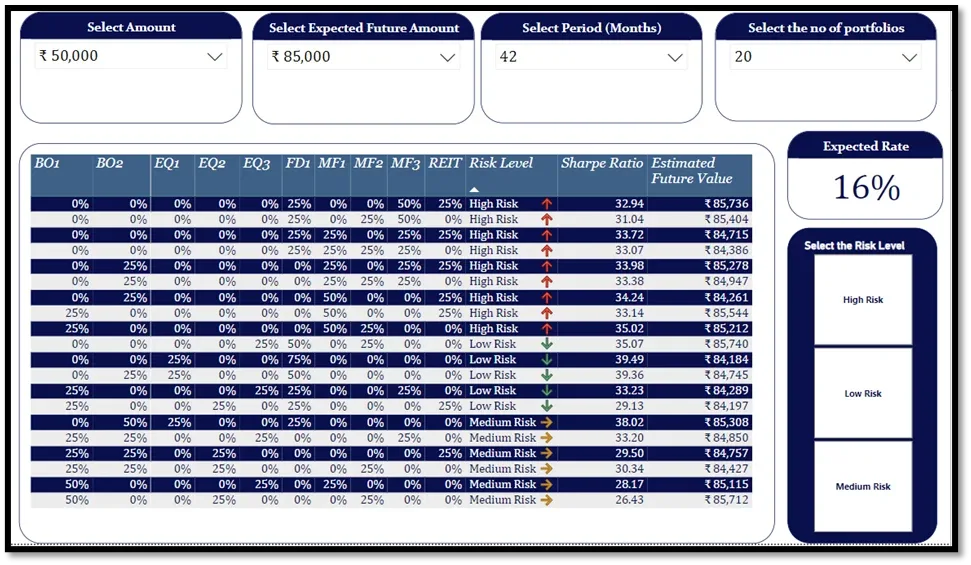
- Objective:
User will be able to input his investment amount, desired future value of investment, period of investment and the number of portfolios to be generated where he/she will be able to see which all portfolios will help to achieve the closest target.
- Visuals
- Slicer- For selecting the investment amount, period of investment, future desired value of investment, Number of portfolios and risk level of the output generated. Risk level is an optional slicer.
- Card- For displaying the expected RoR of the investor based on his desired future value of investment.
- Table- For displaying the percentage of investment required in each investment option to create optimum portfolio.
- Calculations
- Expected Rate of Return (Expected RoR)- the rate formula is used to calculate the interest rate per period of an annuity or investment. The power bi function RATE is used to calculate Expected RoR.
- Rankup1-Ranking based on the difference between Actual and expected RoR and descending order on the basis of the highest Sharpe Ratio.
Page 2: Portfolio Generator Specific
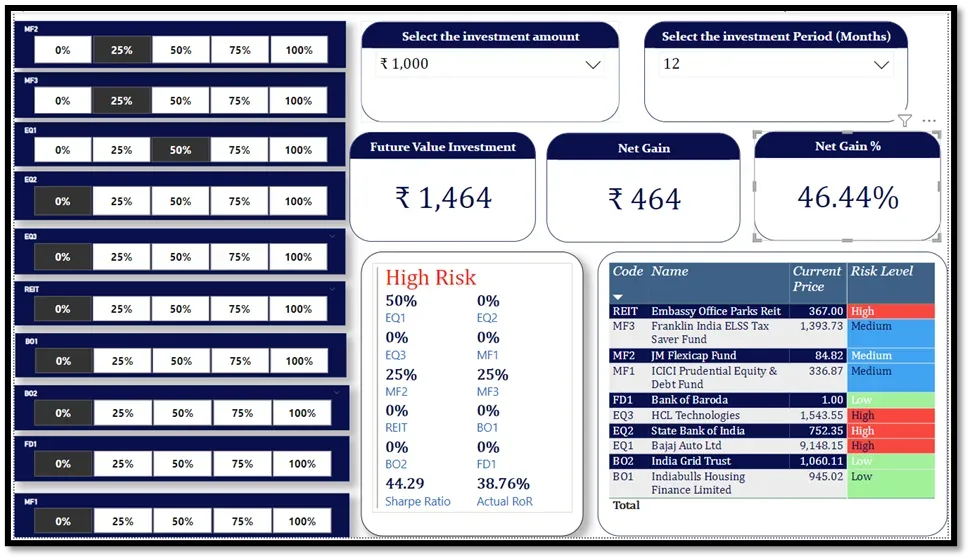
- Objective:
The user who is an educated investors will be able to input the investment amount, and period of investment and choose the investment options in required proportions so as to see the estimated future value and gains from the portfolio chosen.
- Visuals
- Slicer- For selecting the investment amount, period of investment, proportion of money to be invested in each option (should always total to 100%) and Number of portfolios.
- Multi-Card- For displaying the Actual RoR and Sharpe Ratio.
- Table- For displaying the Investment code, original investment name, its current price and risk level.
- Measures
- Future Value Investment- represents the value of an investment at a specific future point in time, taking into account the initial principal amount, the rate of return (interest rate), and the time period over which the investment grows.
The future value (FV) can be calculated using the following formula for compound interest:
FV=P× (1+r) ^ n
Where:
FV = Future Value of the investment
P = Principal amount (initial investment)
r = Interest rate per compounding period (expressed as a decimal)
n = Number of compounding periods (time period over which the investment grows)
- Net Gain- Difference between Future Value Investment and Selected Amount.
- Net Gain% – Percentage Expression of Gains.
- Future Scope of Optimum Portfolio Generation Project
- Real Time or live Data can be used to generate much more realistic estimate of returns of each investment options. Such Dataset needs to be directly pulled or linked from source website (E.g. NSE or BSE website for Shares and Mutual Funds, Bank Websites for Fixed Deposits etc.)
- The Period selected for analysis is 6 months. Instead, if real historical data is used, users can choose the period for analysis themselves to calculate the estimated Rate of Return, which may range from 10Y to even 1 day.
- The number of investment options is currently limited to a maximum of 10 investments to create more than 700 different portfolios. If the calculations and queries can be run for more than 10, then we have higher scope to include all kinds of investments to produce a much more diversified portfolio.
- Currently the user can only select proportion limited to 0,25%,50%,75% and 100%. If the data set can run and create a proportion in terms of 10% interval, then a much more diversified portfolio suggestions can be generated.
- There is a scope to make this tool a lot more user-friendly and hassle free, so that even a laymen can directly use and invest through this tool.