


- 05 May, 2025
- 0 Comments
- 2 Mins Read

Visualizing EV Growth with Power BI: A Data-Driven Approach
For understanding the expanding electric vehicle (EV) market, I built an interactive Power BI dashboard from cleaned EV production data.
The aim was to present significant metrics such as overall production, manufacturers, models, and state-wise distribution in a single viewport. The data was cleaned in Power Query by correcting data types, removing blanks, and sorting fields such as make, model, and year. DAX measures were employed to determine totals and trends.
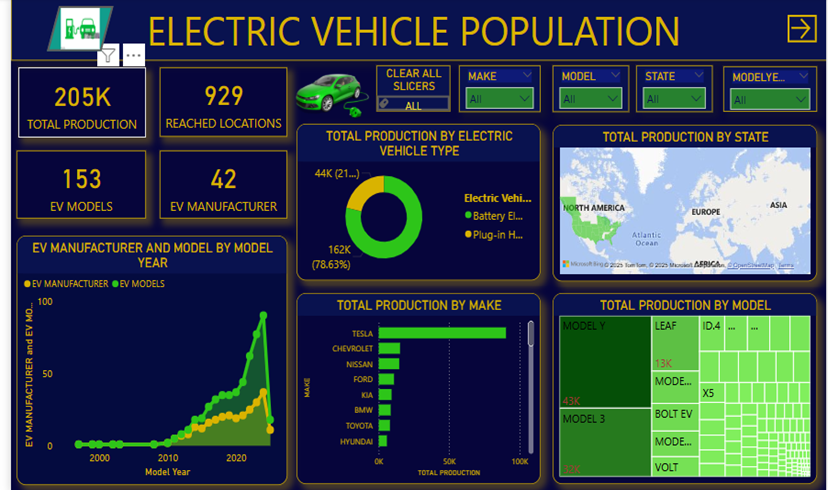
The “Electric Vehicle Population” dashboard shows overall KPIs like total production, number of EV models, manufacturers, and locations. Background visuals like bar charts, donut charts, maps, line graphs, and tree maps provide insights into historical production trends over time, regionally, and by manufacturer. Slicers enable filtering based on state, year, make, and model for easy investigation.
Issues Faced
⚡ Issues faced-
• Inconsistent Data Types: Some fields, including production year and vehicle numbers, contained improper formats that needed to be corrected for accurate calculations.
• Blank and Missing Fields: Most records were incomplete, particularly in key columns such as model and location, that had to be filtered for dashboard accuracy.
• Unorganized Columns: The initial dataset had a flat file structure with information scattered around, which necessitated reorganizing fields such as make, model, and year in a logical order.
•Volume of Data Challenges: Filtering through many records across different states and manufacturers required power filtering and visual performance in Power BI.
•No Built-in Summaries: There were no pre-built summaries in the dataset, so there was a need to build DAX measures from the ground up to gain insightful information.
🔍 Insights Learned
•Understood how to clean and organize EV data for exploratory analysis
•Applied DAX to develop dynamic metrics and filters
•Created a straightforward, intuitive dashboard that enables users to easily identify trends in EV manufacturing