BI Tools
Curriculum
The curriculum is empty
Overview
Oracle BI(Business Intelligence)
The foundation of the Oracle Business Intelligence Suite Enterprise Edition Plus platform is a true BI server that is designed to be highly scalable, optimizing concurrency and parallelism to make the value of BI applications available to the largest possible audience. It provides centralized data access and calculation, essentially creating a large pipe through which anyone can consume any information in any form anywhere in the enterprise. The BI server is central to all of the business processes that consume information, including dashboards, ad hoc queries, intelligent interaction capabilities, enterprise and production reporting, financial reporting, OLAP analysis, data mining, and other Web Service-based applications (J2EE and .NET). All of these applications require rich access to broad sets of data across the enterprise, and they all require a sophisticated calculation and aggregation infrastructure that the platform provides to deliver value
Oracle Data Visualization
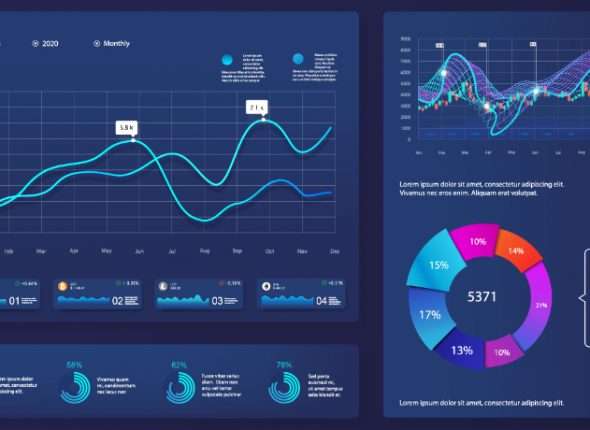
Data visualization describes the presentation of abstract information in graphical form. Data visualization allows us to spot patterns, trends, and correlations that otherwise might go unnoticed in traditional reports, tables, or spreadsheets. Studies show that humans respond to visuals better than any other type of stimuli. The human brain processes visual information 60,000 times faster than text. In fact, visual data accounts for 90 percent of the information transmitted to the brain. Today’s businesses have access to a vast amount of data generated from both inside and outside the organization. Data visualization helps you make sense of it all.
Microsoft Power BI
Power BI is a business analytics solution that lets you visualize your data and share insights across your organization, or embed them in your app or website. Connect to hundreds of data sources and bring your data to life with live dashboards and reports.
Tableau Data Visualisation
Tableau is one of the best tools out there for creating really powerful and insightful visuals. We’re using it for analytics that require great data visuals to help us tell the stories we’re trying to tell to our executive management team. Tableau helps people transform data into actionable insights. Explore with limitless visual analytics. Build dashboards and perform ad hoc analyses in just a few clicks. Share your work with anyone and make an impact on your business. From global enterprises to early-stage startups and small businesses, people everywhere use Tableau to see and understand their data.
Qlikview and QlikSense Fundamentals
Qlik Sense Desktop is a free product that enables you to create interactive reports and dashboards with stunning charts and graphs. The visualization software simplifies data analysis and helps you make informed business decisions faster than ever before.
Discover more insights in your data in just five minutes:
* Drag-and-drop functionality for ease and speed.
* Smart Search feature helps you uncover data relationships.
* explore multiple data sources easily in a single app.
* Collaborate and share insights with rich data story telling.
Certification
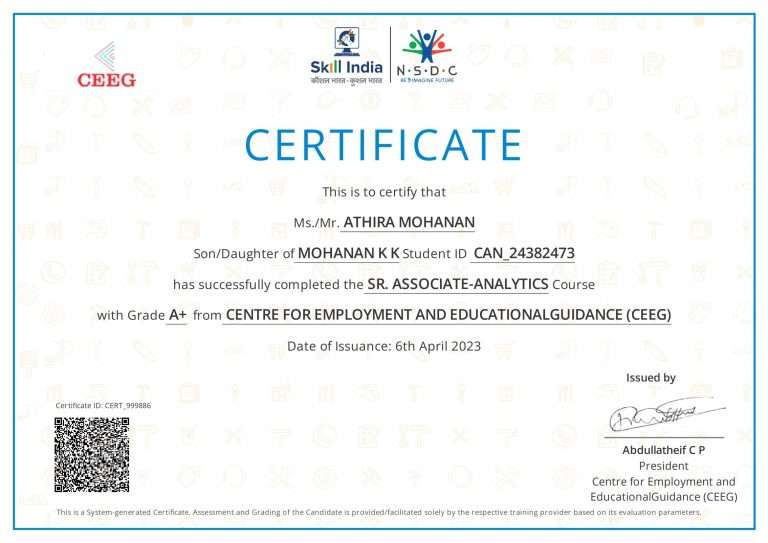 Benefits of NSDC certification
- The course content has been vetted and approved by the NSDC, meaning it aligns with industry standards and has a good chance of leading to employment.
- The training center has met certain quality standards, such as having a certain number of trainers and equipment.
- You may be eligible for a loan from the NSDC to pay for the course.
- You may be able to get a certificate recognized by the government and industry.
- You may be able to get placement assistance after completing the course
Oracle BI(Business Intelligence)
The foundation of the Oracle Business Intelligence Suite Enterprise Edition Plus platform is a true BI server that is designed to be highly scalable, optimizing concurrency and parallelism to make the value of BI applications available to the largest possible audience. It provides centralized data access and calculation, essentially creating a large pipe through which anyone can consume any information in any form anywhere in the enterprise. The BI server is central to all of the business processes that consume information, including dashboards, ad hoc queries, intelligent interaction capabilities, enterprise and production reporting, financial reporting, OLAP analysis, data mining, and other Web Service-based applications (J2EE and .NET). All of these applications require rich access to broad sets of data across the enterprise, and they all require a sophisticated calculation and aggregation infrastructure that the platform provides to deliver value
Oracle Data Visualization
Data visualization describes the presentation of abstract information in graphical form. Data visualization allows us to spot patterns, trends, and correlations that otherwise might go unnoticed in traditional reports, tables, or spreadsheets. Studies show that humans respond to visuals better than any other type of stimuli. The human brain processes visual information 60,000 times faster than text. In fact, visual data accounts for 90 percent of the information transmitted to the brain. Today’s businesses have access to a vast amount of data generated from both inside and outside the organization. Data visualization helps you make sense of it all.
Microsoft Power BI
Power BI is a business analytics solution that lets you visualize your data and share insights across your organization, or embed them in your app or website. Connect to hundreds of data sources and bring your data to life with live dashboards and reports.
Tableau Data Visualisation
Tableau is one of the best tools out there for creating really powerful and insightful visuals. We’re using it for analytics that require great data visuals to help us tell the stories we’re trying to tell to our executive management team. Tableau helps people transform data into actionable insights. Explore with limitless visual analytics. Build dashboards and perform ad hoc analyses in just a few clicks. Share your work with anyone and make an impact on your business. From global enterprises to early-stage startups and small businesses, people everywhere use Tableau to see and understand their data.
Qlikview and QlikSense Fundamentals
Qlik Sense Desktop is a free product that enables you to create interactive reports and dashboards with stunning charts and graphs. The visualization software simplifies data analysis and helps you make informed business decisions faster than ever before.
Discover more insights in your data in just five minutes:
* Drag-and-drop functionality for ease and speed.
* Smart Search feature helps you uncover data relationships.
* explore multiple data sources easily in a single app.
* Collaborate and share insights with rich data story telling.
Certification

- The course content has been vetted and approved by the NSDC, meaning it aligns with industry standards and has a good chance of leading to employment.
- The training center has met certain quality standards, such as having a certain number of trainers and equipment.
- You may be eligible for a loan from the NSDC to pay for the course.
- You may be able to get a certificate recognized by the government and industry.
- You may be able to get placement assistance after completing the course
